I turn cutting‑edge research into toys, tools, and stories.
I’m Anna M. Campbell, a biologist turned creative producer and marketer, and the founder of Solarpunk Studio, a science communication practice. For 12 years I’ve led communications strategy and production for scientific and technical projects: video series, campaigns, exhibits, data stories, and community-driven experiences that make complexity cool (and often a little funny). From millions of views on YouTube to bar charts made of jelly beans, I make research feel human through toys, tools, and stories that connect us to each other, the future, and the planet we call home.
Frontier models are the foundation of everything I do nowadays, from the first sketch to the public debut and each round of feedback from real people. Below you’ll find whales, sea otters, 3D viruses, a neuron dancefloor, a force-directed visualization, magical meditations, team bonding, elevator pitches, watchdog journalism, and one very memorable fire.
Turning the Tide
Immersive exhibit on ocean solutions
- Exhibit design
- Offline kiosk app
- Partner data
- Fabrication
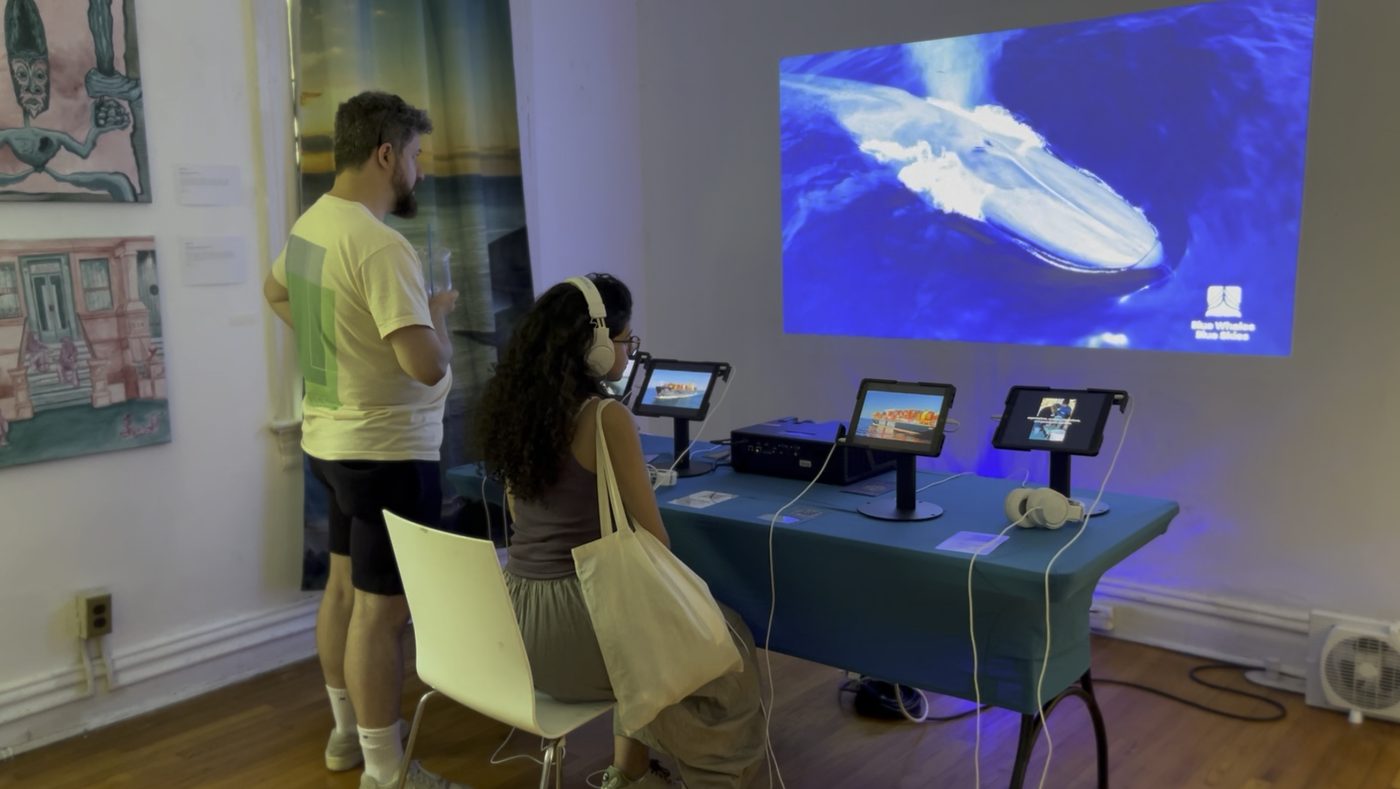
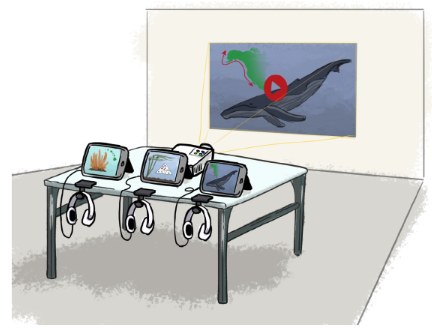
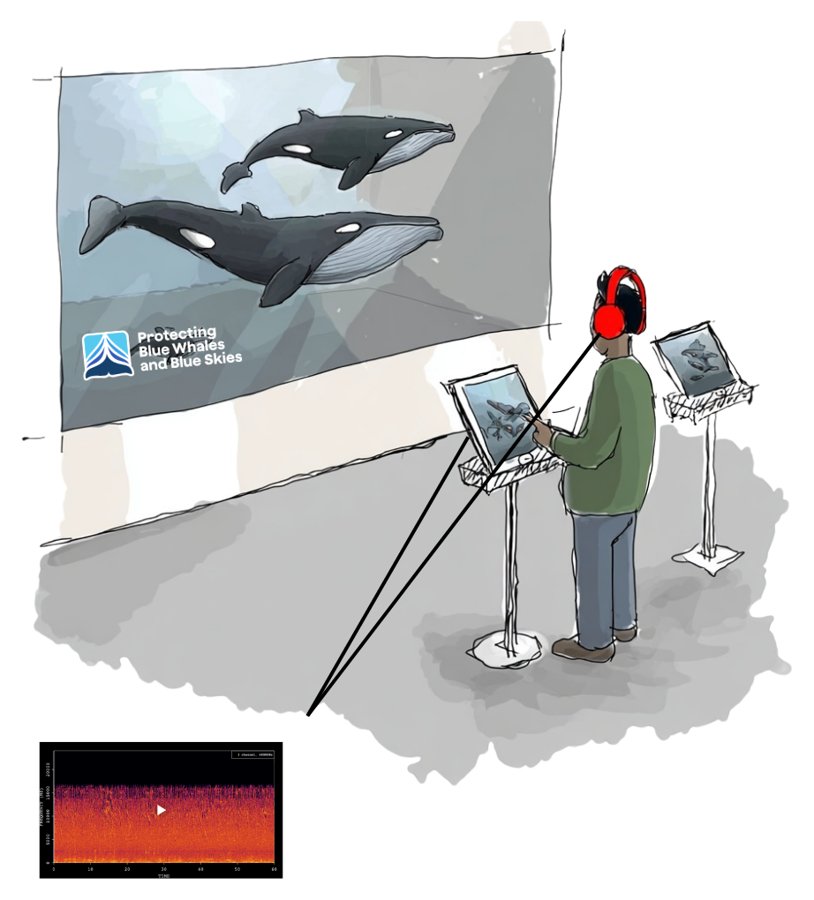
Turning the Tide: Ocean Solutions in Action is a hopeful tour of ocean solutions that are already working, from clam and coral restoration to slower ships that protect blue whales. I created it for the Climate Imaginarium, the art and education space that opened ahead of a $700M climate research center planned for Governors Island in 2028. I pitched it to the Blue Whales Blue Skies initiative and brought them on as sponsor myself, worked with Sonos to get speakers into the room, and then built it. Three long-time communications clients came back as content partners: the Hawaiʻi Institute of Marine Biology, the California Marine Sanctuary Foundation, and Ocean Youth Academy. Friends of the Bay joined to give the exhibit a local tie-in in New York. Visitors moved through physical installations and iPad stations with soundscapes, interactive maps, and data stories on whale migration and coral reefs. Along the way, they grew a coral fragment month by month and practiced the citizen science sampling that students do aboard polar expeditions.
- Audience
- 3,000+ visitors over six weeks (free admission)
What the model doesBehind the scenes, Lovable (built on Claude) processed each partner’s data and co-wrote the code for every offline iPad app. Visitors never talk to a model directly. Scientists reviewed every video and interactive, and all four partners signed off on their content. The hardest fix was getting the code Lovable wrote to run fully offline on the iPads.





- Me
Pitched an original exhibit on ocean solutions to Blue Whales Blue Skies, which signed on as sponsor
- Partners
Four partner organizations shared their data and stories
- AI
Processed each partner’s data in Lovable (built on Claude)
- MeAI
Designed and built every iPad experience as an offline kiosk app
- MeAI
Laid out the exhibit, scoped the physical build, and bought the materials
- Operations managerSpatial computing engineer
Installed it with me
- Volunteer coordinator
Ran the space for six weeks
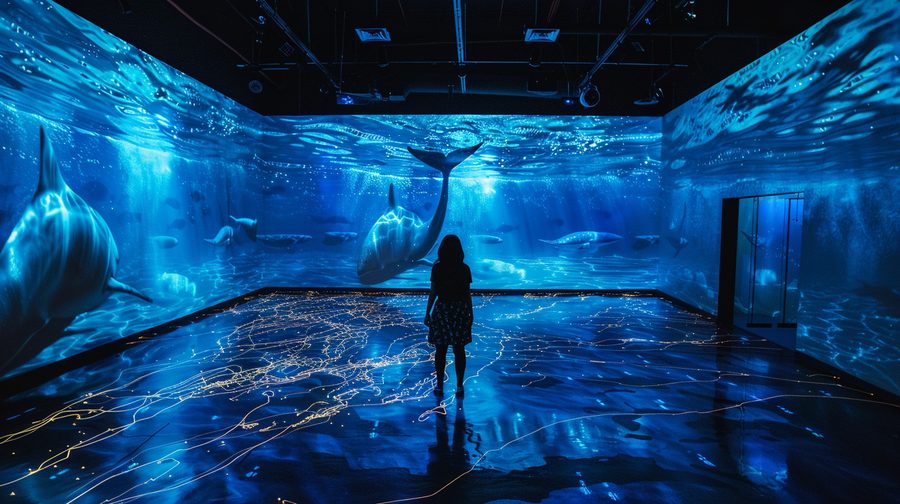
A room-scale version with projection mapping, where visitors see shipping lanes and whale migration routes side by side, and their own footsteps and voices move the whales. OpenAI’s realtime voice model (gpt-realtime) would listen as people talk and steer the visuals and soundscape in response. A bigger Sonos sponsorship and their equipment would bring it closer to the full-scale vision in the concept image.
Seeker: The Swim and How Close Are We?
Science video series · A 3-million-subscriber science channel
- Series production
- Science video
- Research partnerships
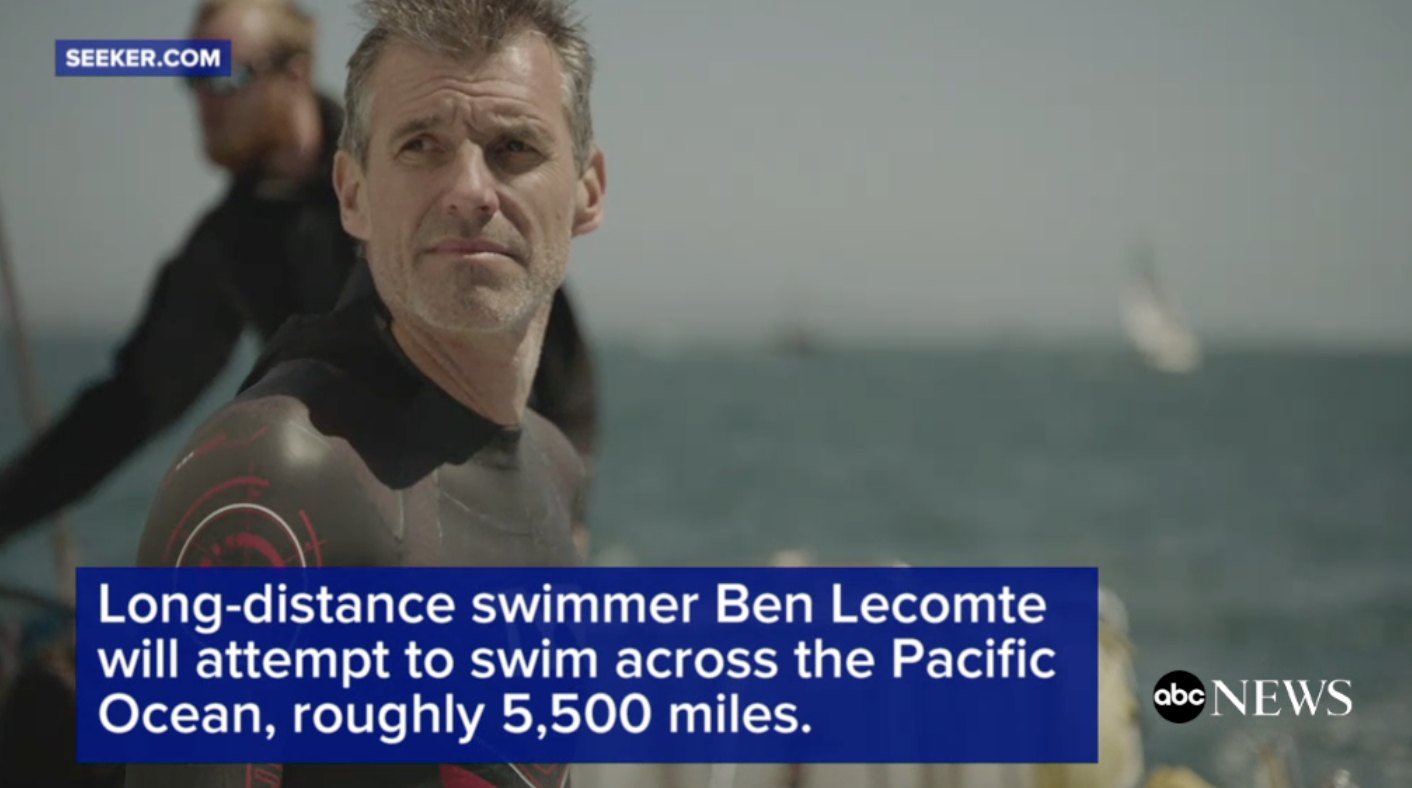
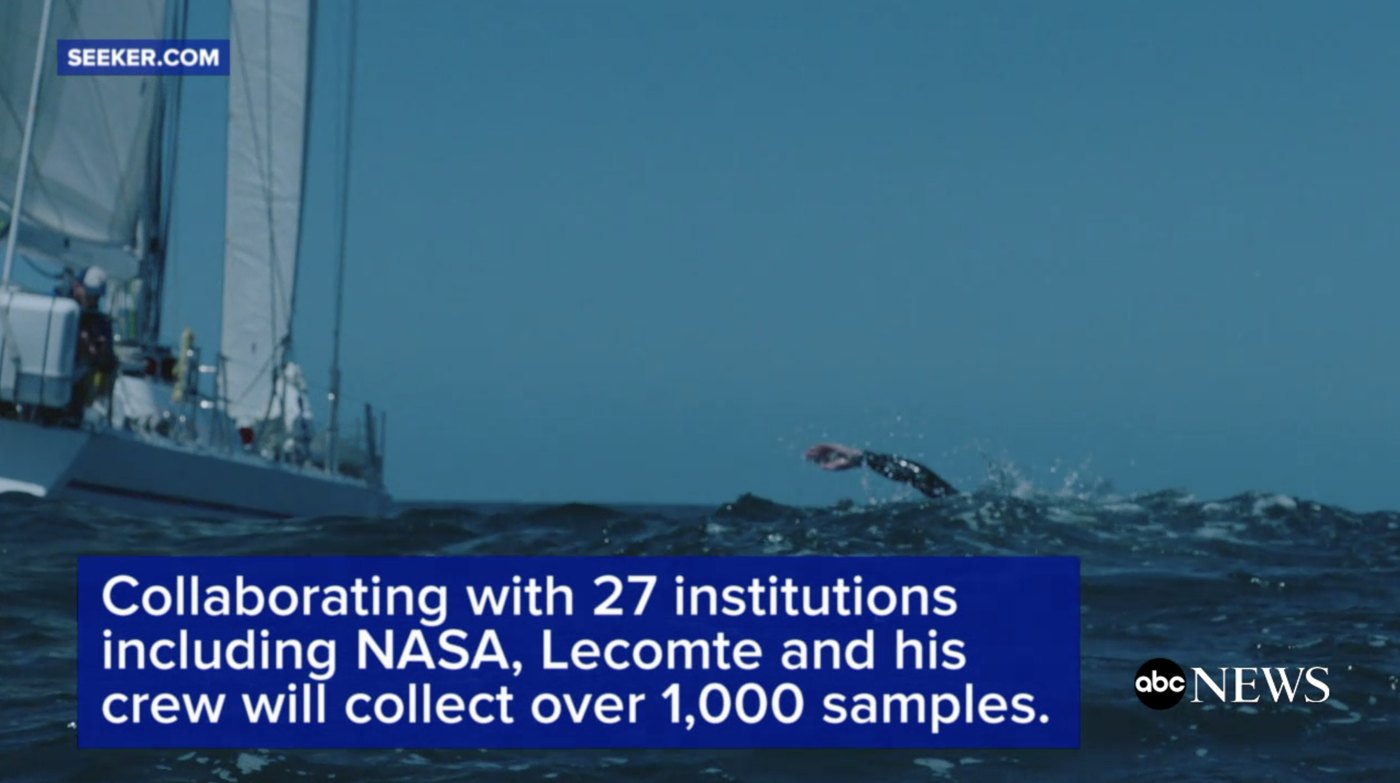
At Seeker I pitched and wrote episodes for six science series, Elements, Sick, Science in the Extremes, Tusks to Tails, The Swim, and How Close Are We?, and helped shape their format and look. The Swim was the biggest. Built with Discovery, it followed endurance athlete Ben Lecomte’s attempt to swim more than 5,000 miles across the Pacific, with his boat doubling as a floating lab for 27 research institutions. As project manager and producer of the mid-form series, I helped turn each research project into a 5 to 7 minute YouTube deep dive, from microplastics and Fukushima radiation to what his heart and bones could teach long-duration spaceflight. How Close Are We? asked how near we are to solving some of humanity’s biggest scientific challenges, like landing on Mars and curing cancer.
I also owned the packaging: thumbnails, titles, and metadata. I watched how each episode performed, swapped in new packaging when it lifted views, and steered storytelling strategy toward what drew people in. Several episodes passed 1 million views.
- Audience
- Seeker’s 3 million subscribers, plus Discovery’s audience through weekly updates and a feature documentary
What the model doesNothing. I made these from 2017 to 2020, before frontier models. They show how I turn research into stories millions of people choose to watch.




- +25 more institutions
 1M views
 401K views
 608K views
 407K views
 398K views
 497K views
- Team
The editorial team set up six science series
- MeTeam
Pitched and wrote episodes, and shaped each series’ format and look
- Me
Project-managed The Swim with Discovery, Nomadica Films, and 27 research institutions
- Scientists
Shared their findings from NASA, MIT, Harvard, NIH, and more
- Me
Turned the findings into scripts and storyboards for the mid-form deep dives
- Video crew
Editors and cinematographers shot in the studio and the field, and cut each episode
- MeTeam
Sharpened formats with audience data, and owned thumbnails, titles, metadata, and SEO
A live companion for an expedition like The Swim, where a model turns each day’s research data into a short update viewers can ask follow-up questions about.
Field Notes
Live event app · NorCal Venture Conference
- Whisper transcription
- QR and SMS entry
- Live events
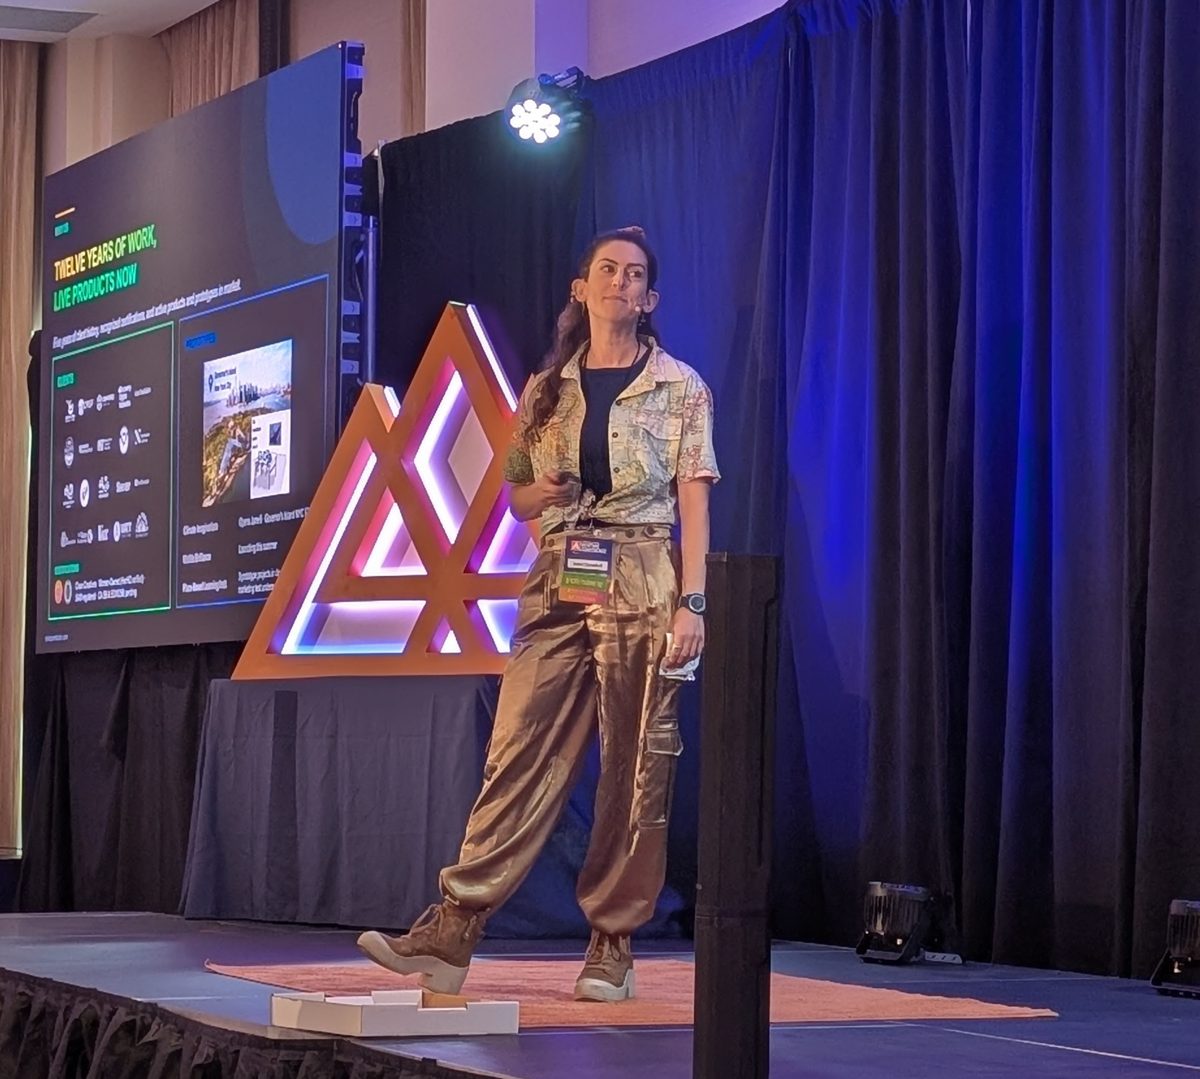
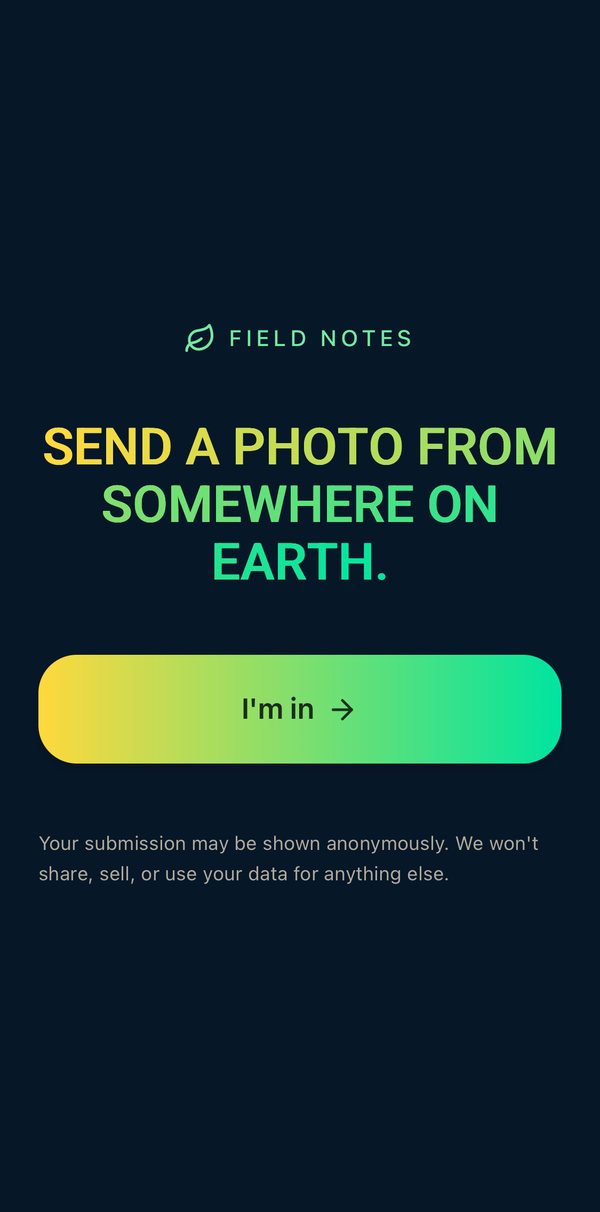
I developed Field Notes for the Northern California Venture Conference in Redding and ran it live there in May 2026. Attendees scanned a QR code, sent a photo from their personal lives, and recorded a voice note about it, with no account needed. Since the conference, I've received inquiries about using it as a team-bonding product for companies.
- Audience
- A room of 100+ at the NorCal Venture Conference, who watched a live map of 14 attendees’ photos and voice notes during my pitch
What the model doesIt works live in the room. Whisper transcribed each voice note as it arrived, so every story was on the map in time for the pitch. Lovable (built on Claude) wrote the app itself. Whisper's transcripts held up well, but some people needed coaching to leave a useful voice note, and some couldn't record on the spot. Voice was still the most accessible way in.

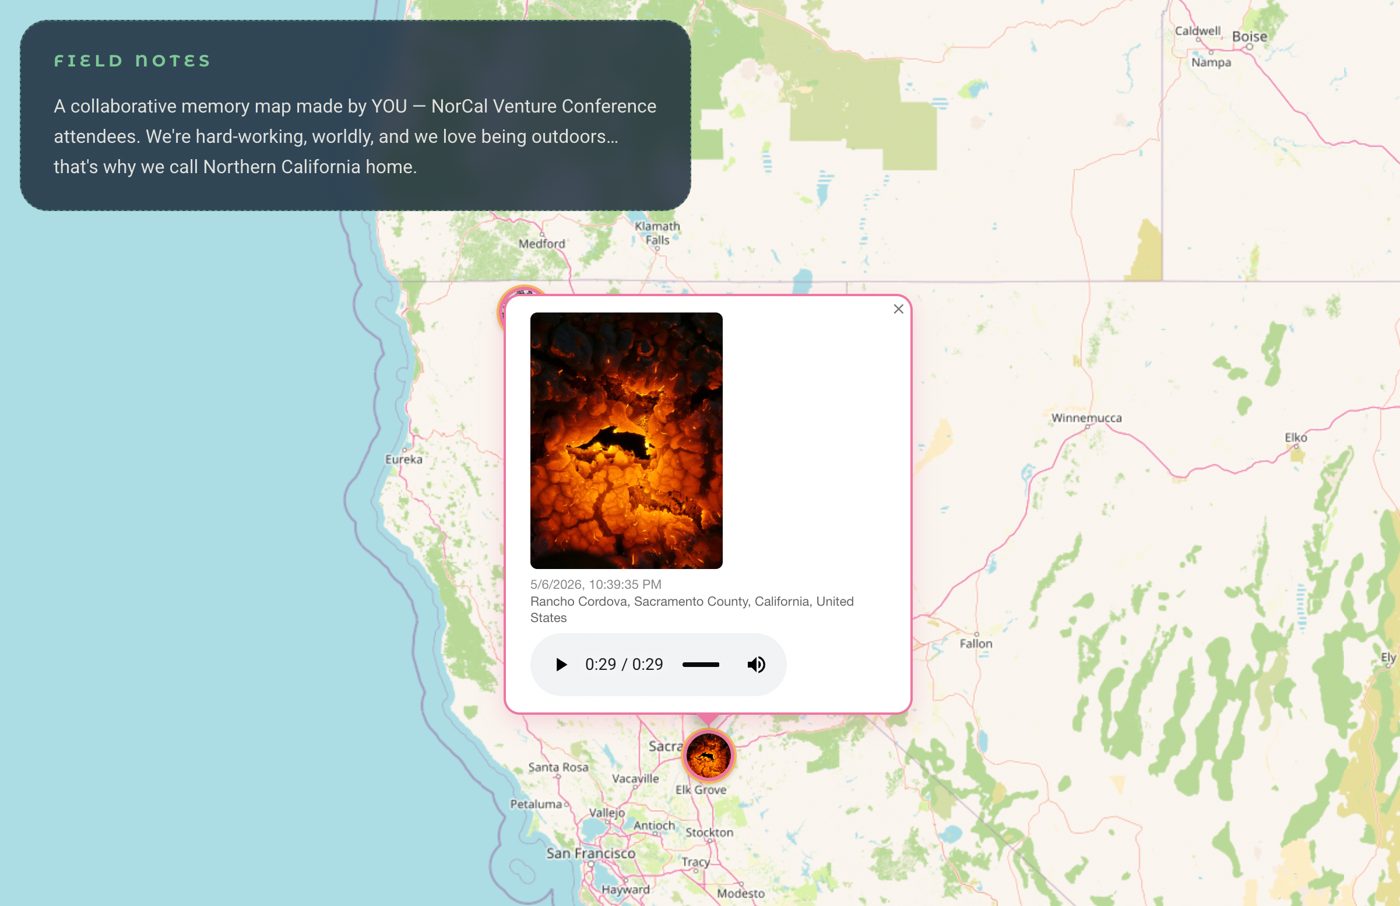
Field entry · Rancho Cordova, CA“I was at the test center, doing this experiment of burning one of the materials with a torch, and this is the pattern that was seen on the material while burning, and the way I felt was like a hunter in the middle of the winter, looking into the fire in the middle of the night.”
- Me
Came up with it for the NorCal Venture Conference
- AI
Built the app in Lovable (built on Claude)
- Me
Ran it live at the conference in May 2026
- Attendees
Sent in every photo and voice note
- AI
OpenAI’s Whisper transcribed each voice note as it came in
- Me
Told the winner’s story in his own photo and voice, and showed the map during my pitch
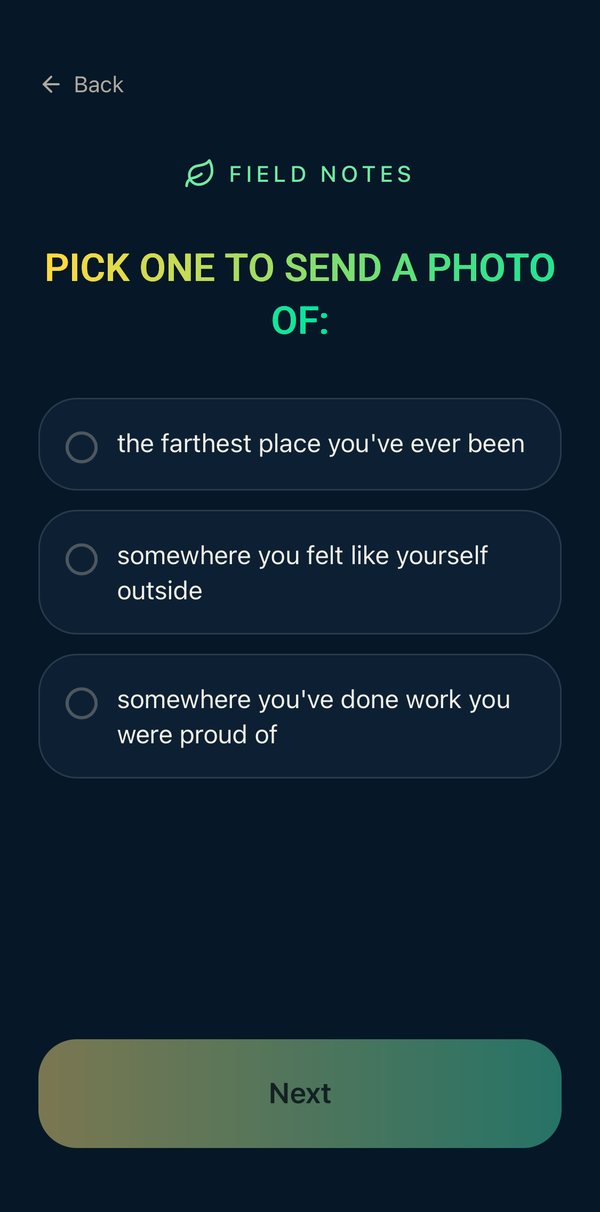
 Choose a photo
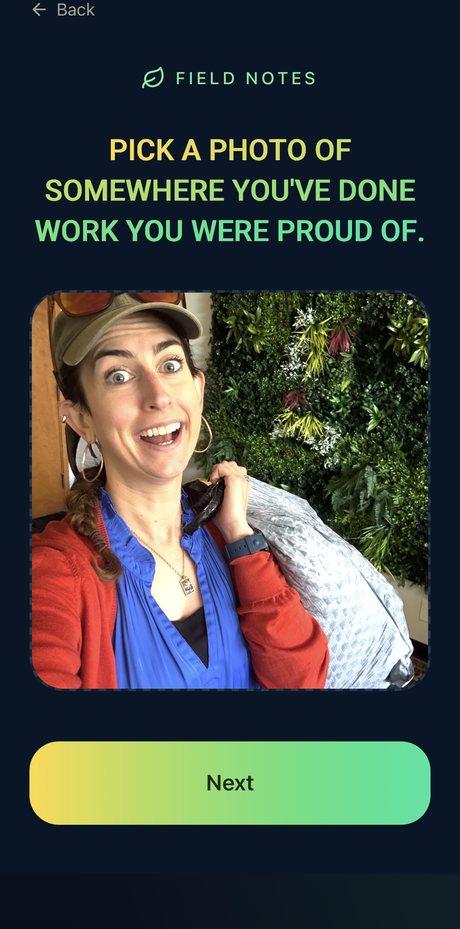 When you’re the CEO but also the janitor
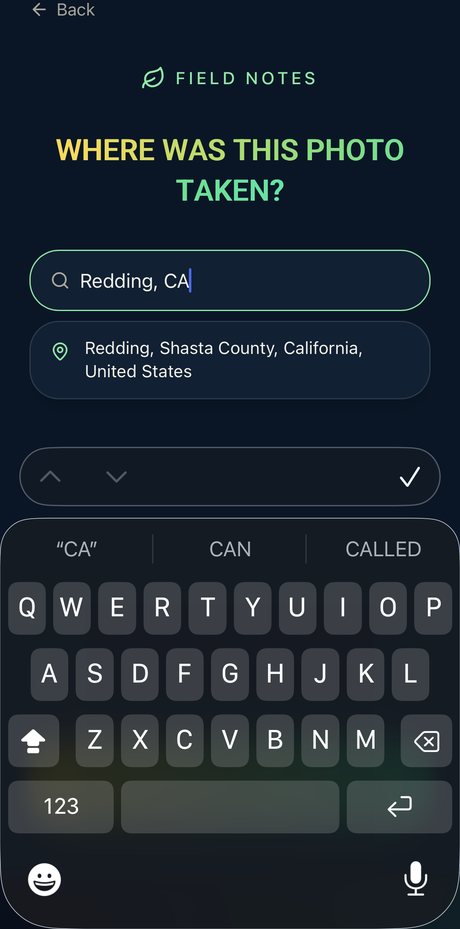 Where was it taken?
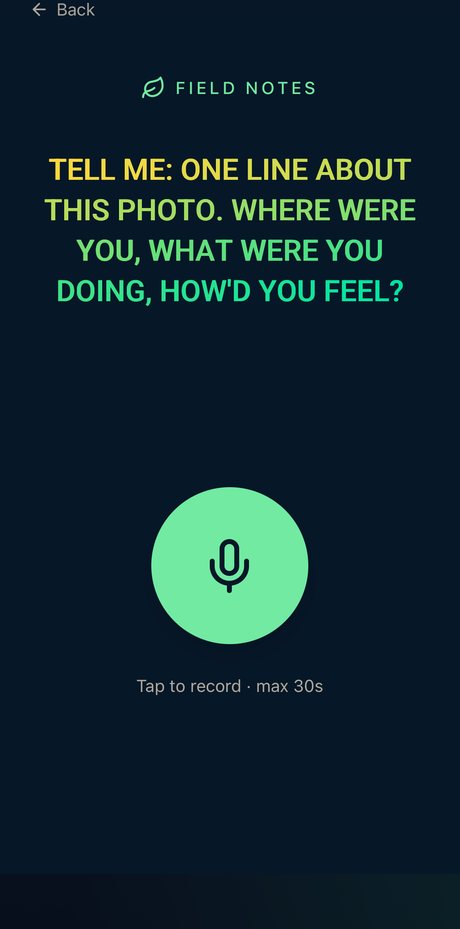 One line, out loud
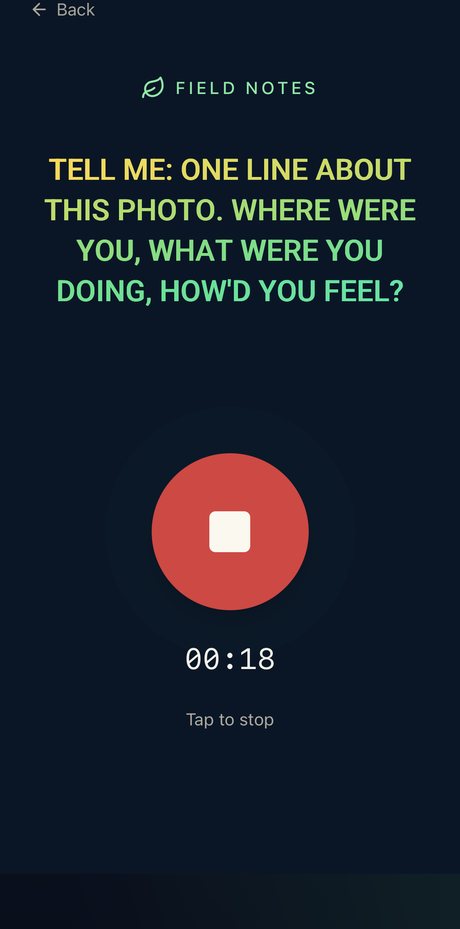 Recording (30 sec max)
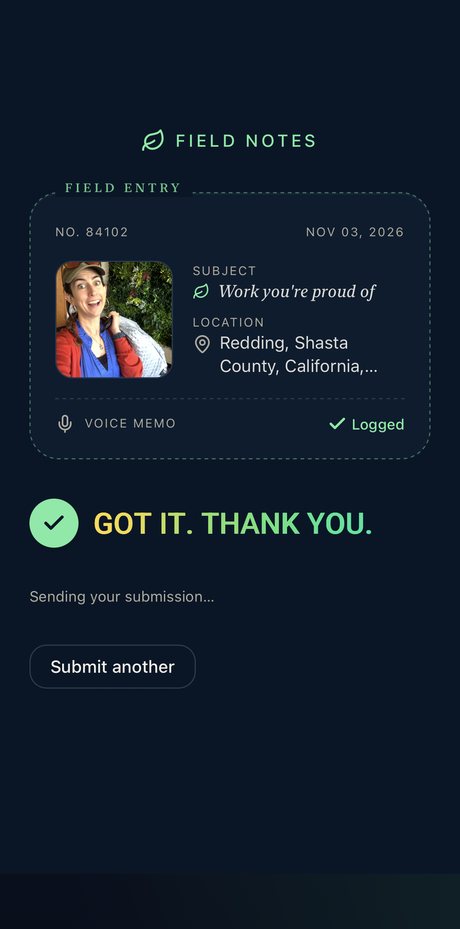 Logged as a field entry
The possibilities are honestly endless. Team bonding with prompts written for each group, but also stories that unfold as people interact with each other through their phones, the way Smartphone Orchestra's work does, set in real landscapes and paired with citizen science.
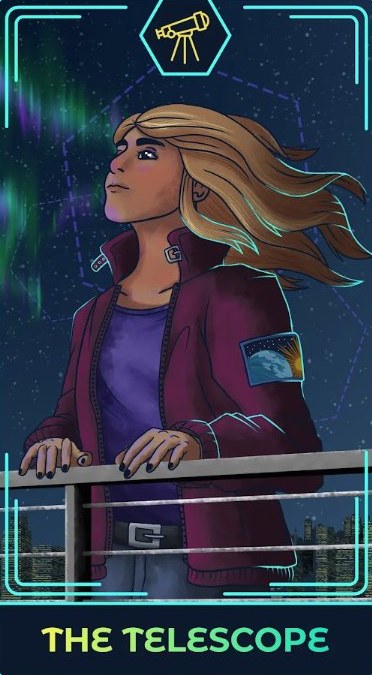
Visible Brilliance (The Elevator Drop)
Visibility program for women in STEM · quiz, challenge, and live games
- Game design
- Live facilitation
- Zoom Immersive View
- Character design
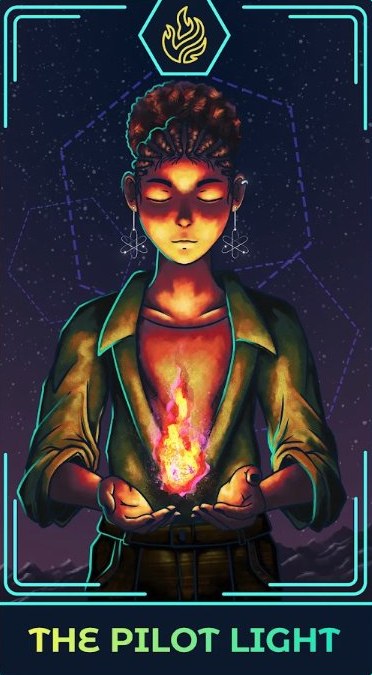
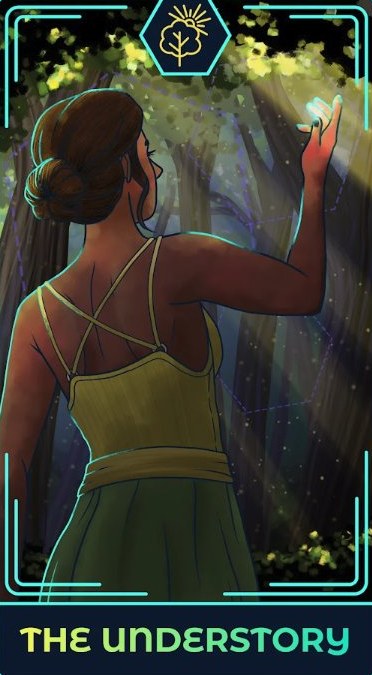
Visible Brilliance is my studio's path for women in STEM who do brilliant work that few people see. It starts with a short video and a quiz that matches you to a hand-illustrated archetype, and more than 200 people have taken it. Its leads cost half what they did in our 2025 ad test. Next comes Recess, a 14-day challenge that mixes journal prompts with short social and communication exercises. It includes two AI tools: one pulls your organization's LinkedIn audience data so you can see who you're reaching now, and a counterweight version of AffirmMagic closes the challenge.
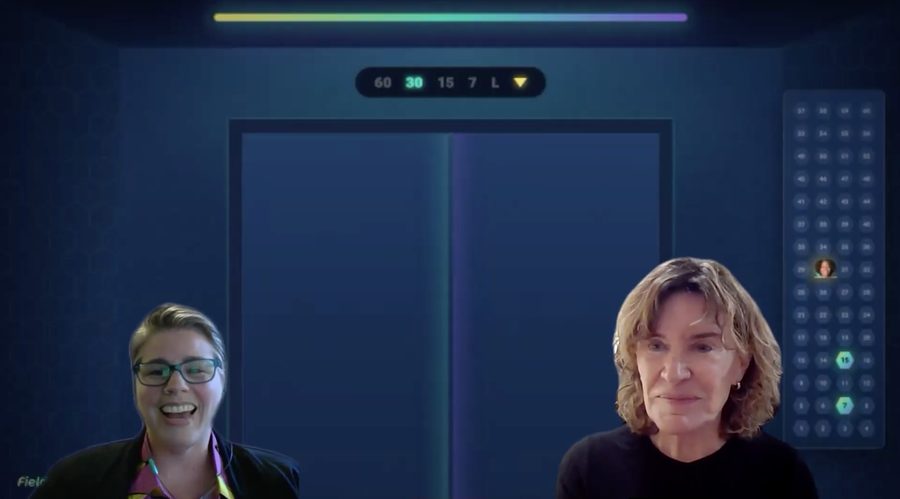
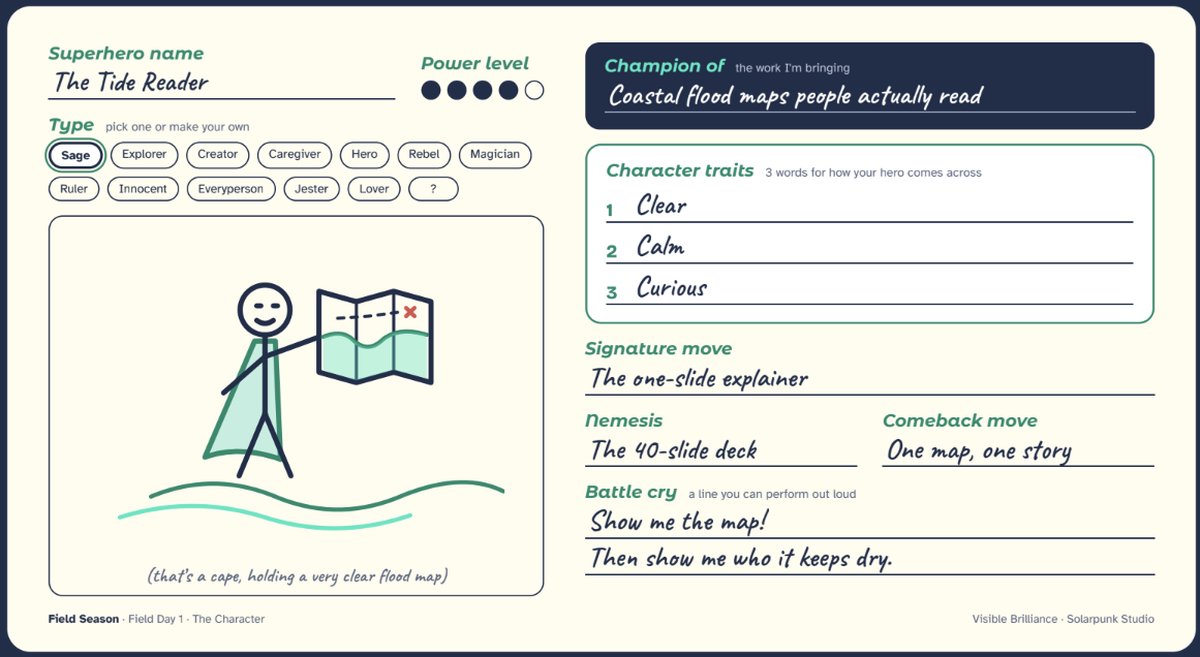
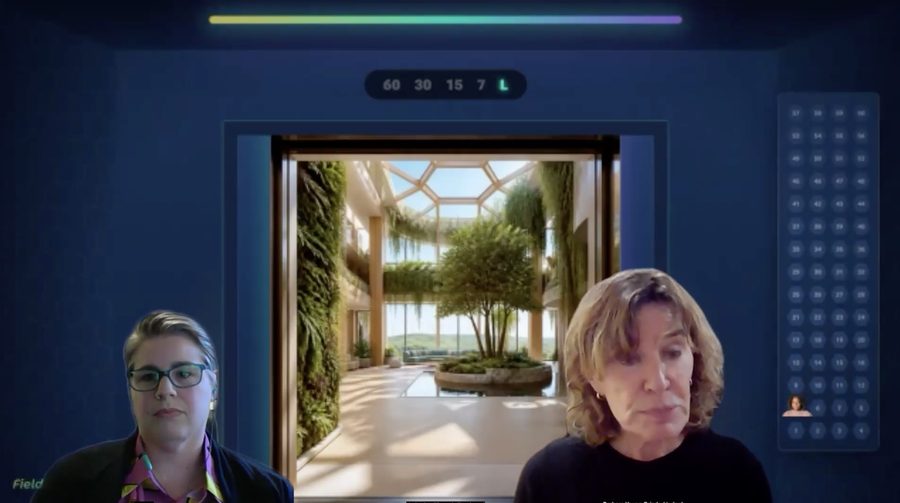
Field Season, the eight-week program, turns all of it into live creative games, one a week, each judged by a guest expert. I developed the games' mechanics and materials with AI. Two of them are shown here. In the first, each scientist builds her superhero: a card with a hero name, archetype, signature move, nemesis, and a battle cry she can say out loud. In the Elevator Drop, she pitches as that hero in an elevator we built in Zoom's Immersive View, riding with the judge, an angel investor who plays the person she most needs to win over. Every floor, her pitch has to shrink: 60 seconds, then 30, then 15, then 7. When the doors open on the lobby, the judge walks her through what landed, and she walks out with a seven-second version of her work.
- Audience
- 200+ quiz takers, then pilot cohorts of Recess and Field Season
What the model doesGame design partner for all eight Field Season games, including the superhero card and the elevator floors. In Recess, a LinkedIn audience tool I built in Lovable (on Claude, in beta) shows each woman who her organization reaches now. Testing is in progress with the first cohorts.
- Me
Designed the quiz, the Recess challenge, and the eight-week program with its eight games
- Illustrator
Hand-drew the quiz archetype cards
- MeAI
Built the LinkedIn audience tool for Recess
- MeAI
Designed the superhero card players build on Field Day 1
- MeAI
Developed the Elevator Drop concept and its graphics, including the elevator floors
- Operations manager
Ran the elevator live: placing players, keeping time, and calling the floors
- Angel investor judge
Played the person each scientist most needs to win over, then judged each pitch
- Me
Hosted each game
Words that survived. Whisper transcribes every floor, and when the doors open, the screen highlights the phrases that made it from 60 seconds down to 7, so the judge's feedback starts from the player's own words. The live judge stays human, but a tool like Coach Clone could turn their feedback into a small agent players can practice with after the session ends.
Reinvent 2025
Two-day summit · Data Playground installation
- Event production
- Physical data visualization
- Installation
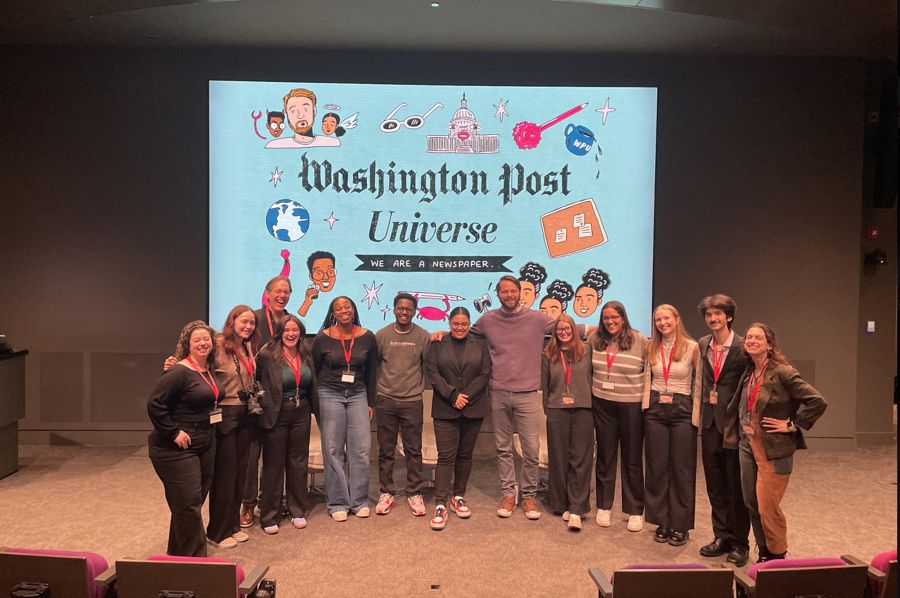
I produced Reinvent 2025, a two-day summit at Northeastern for Reinventing Local TV News, the Stanton Foundation-funded program I manage. It brought 3 keynotes, 14 panels, and 47 presenters, including Vox Media Editor-in-Chief Swati Sharma, PBS Digital Studios head Maribel Lopez, and The Washington Post's TikTok team, to nearly 500 attendees from GBH, The Boston Globe, NBCUniversal, and more, and came in under its $71K budget.
Data Playground
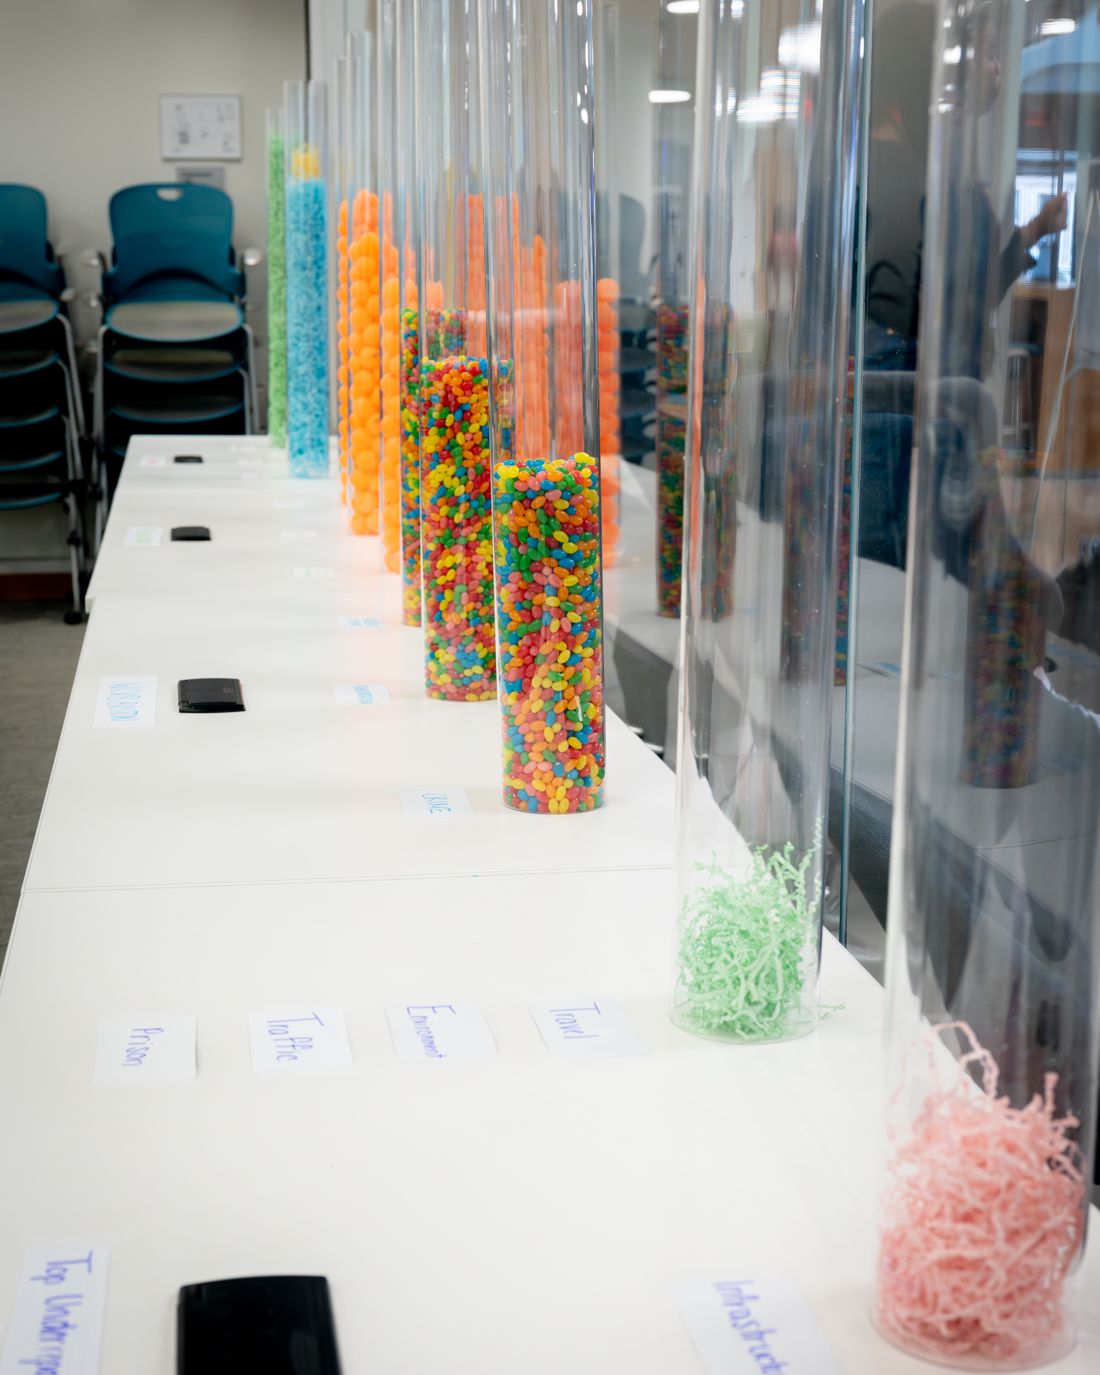
At the summit's center, I turned the program's research into a room people could walk through. Local news coverage became bar charts of clear tubes, one per category, filled with a mix of jelly beans, ping pong balls, and Easter grass. Fish bowls full of facts and tips sat around the room, and visitors added data of their own, from the topics they want more of in the news to their takeaways from the day.
- Audience
- Nearly 500 summit attendees, who walked the jelly bean chart and added their own data, from the news topics they want more of to their takeaways from the day
What the model doesChatGPT helped write the scraper that counted stories at each station, then worked out how many jelly beans each tube of a room-sized bar chart would need. ChatGPT's materials estimates were mostly right, though I did end up with the wrong kind of tubing.
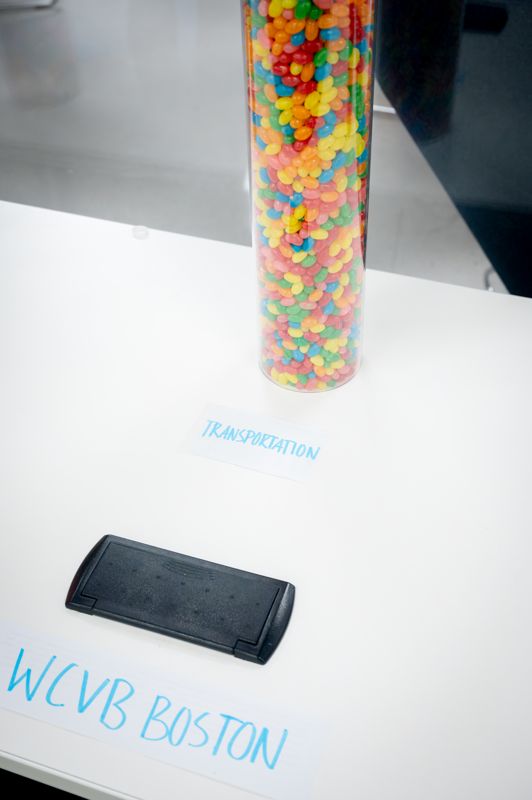 Transportation, WCVB Boston
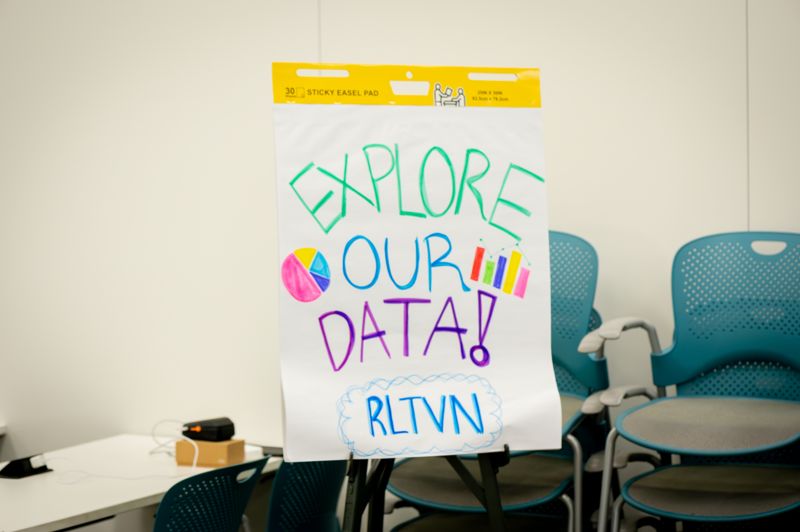 The invitation
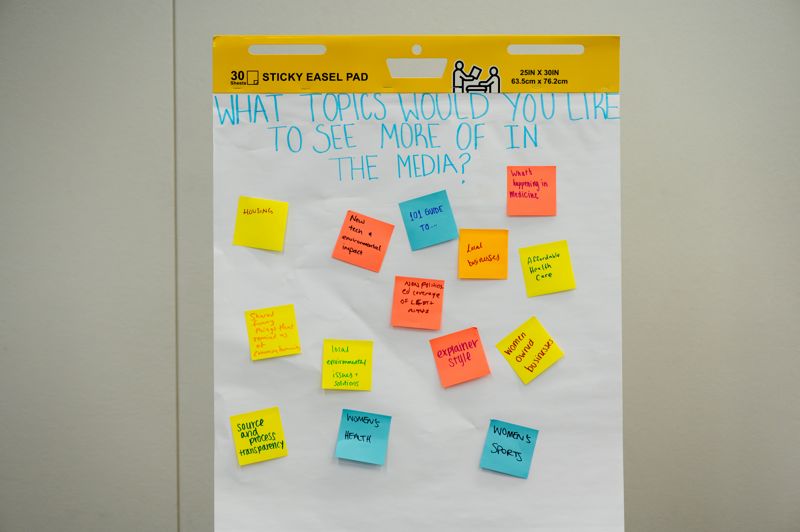 Visitors add their own data
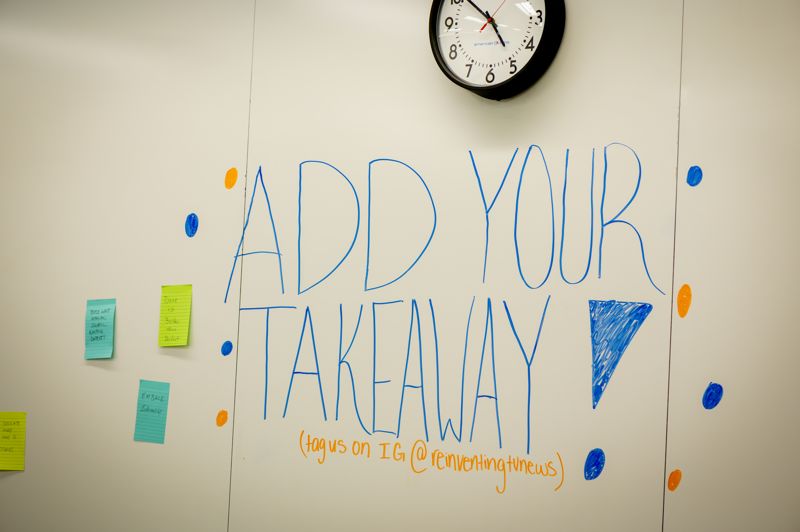 Takeaways on the wall
- Research teamAI
Wrote the code that scraped story counts from each station, with ChatGPT’s help
- Me
Designed a room people could walk through for the summit
- MeAI
Worked out how many jelly beans each tube needed and which tubing to buy
- MeResearch team
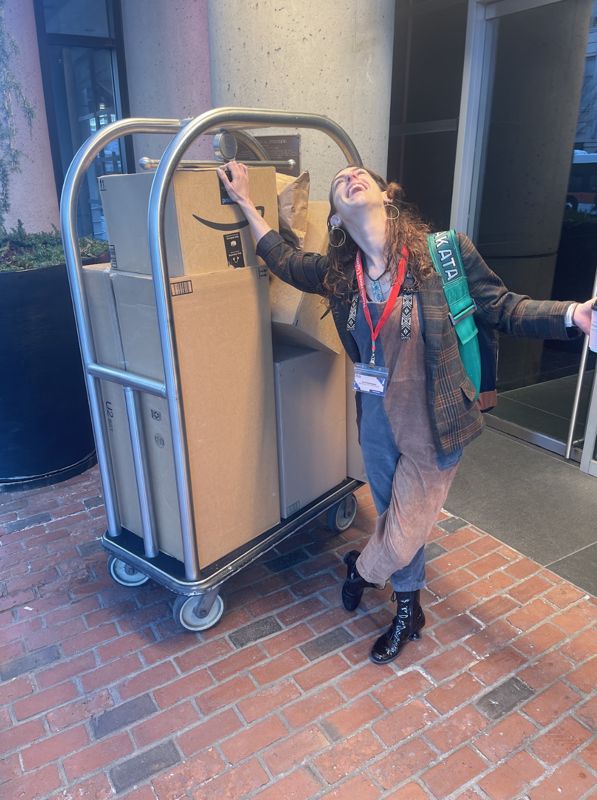
Built and set it up with markers, easels, and a lot of candy (somewhere along the way, a teammate accidentally subscribed us to regular shipments of jelly beans)
- Me
Hosted the room and evaluated it
Bring your own algorithm. Hook your phone up to the projector, scroll your social feed for 30 seconds, and get an instant readout of your own media diet, side by side with the “mainstream” diet in the jelly bean tubes, which shows what linear TV covers in major urban markets.
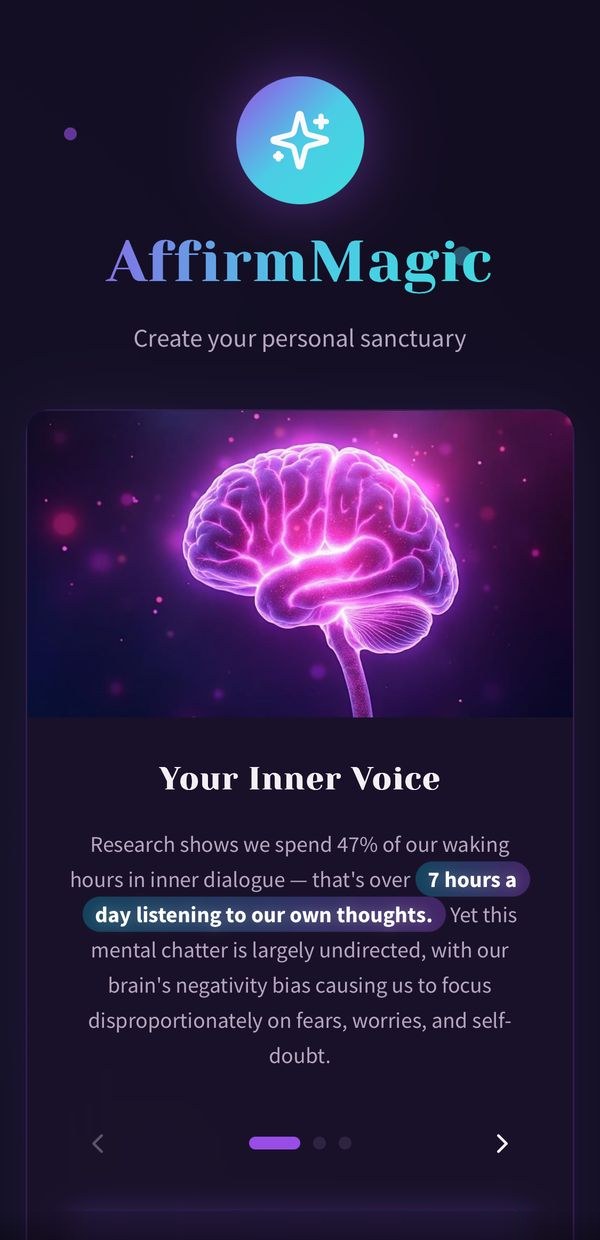
AffirmMagic
Voice AI app · in beta
- Voice cloning
- Audio design
- Mobile web app
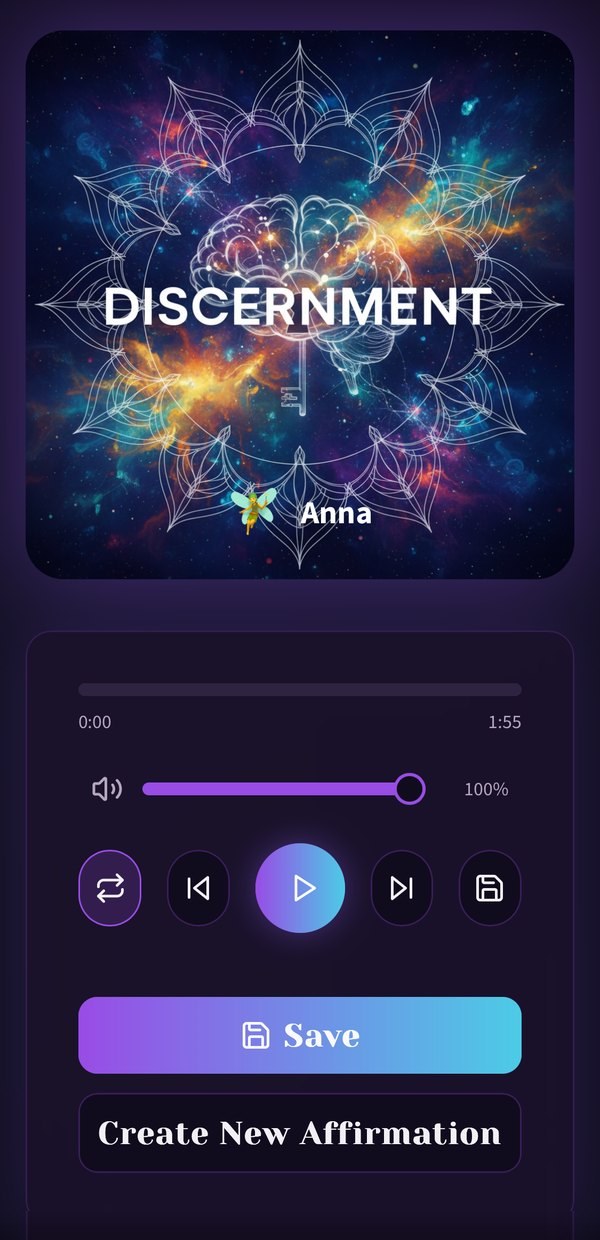
This is an affirmations and meditation app where your own voice does the talking. You script affirmations with a guide, record or pick a voice, and layer it over ambient sound. Then you can play it back from a personal library, even with your phone locked.
- Audience
- In beta with 23 testers, including participants in Recess, my studio's challenge for women in STEM
What the model doesIt is the voice. Gemini 2.5 Flash drafts and screens each affirmation script, ElevenLabs Multilingual v2 speaks it back to you, and Gemini 2.5 Flash Image designs the cover. Not every voice landed, so I auditioned them all and kept only the ones that sounded calm and natural. Getting the generated audio player to keep playing on a phone's lock screen took many more rounds.
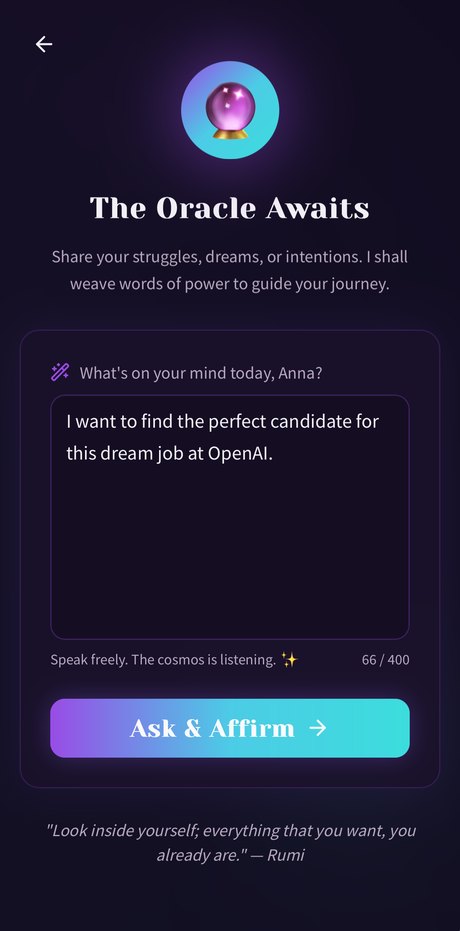 Say what is on your mind
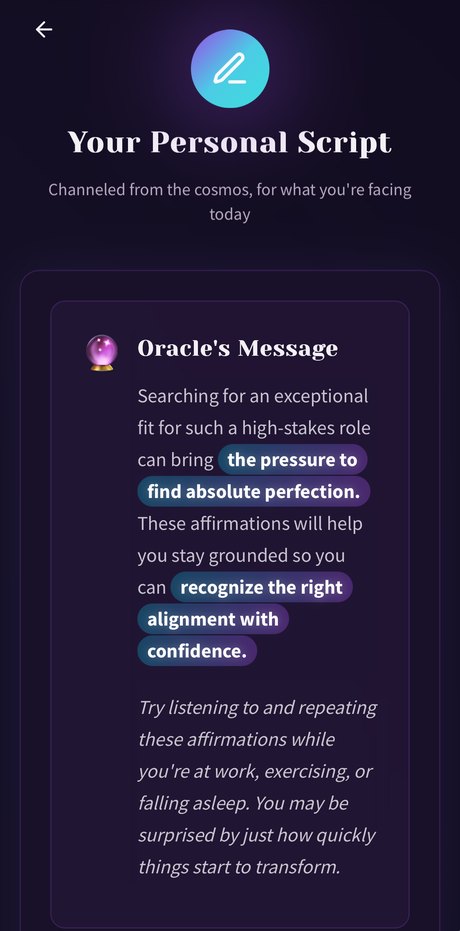 The Oracle reframes it
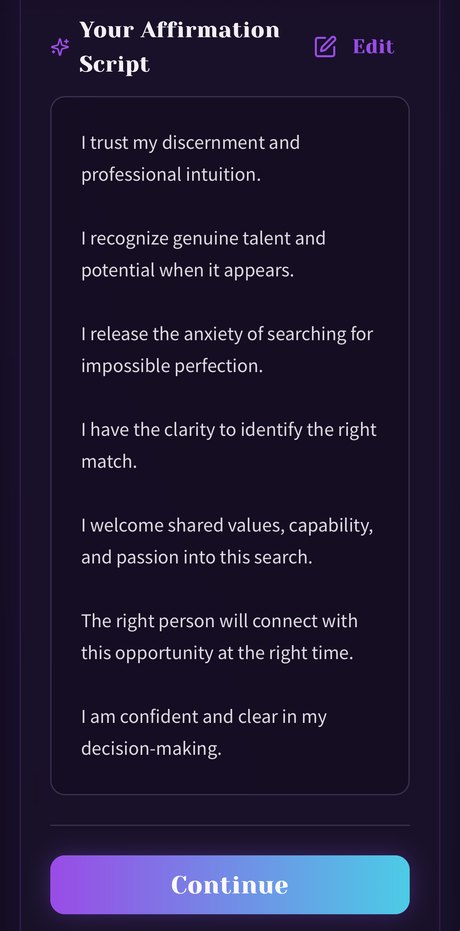 A personal affirmation script
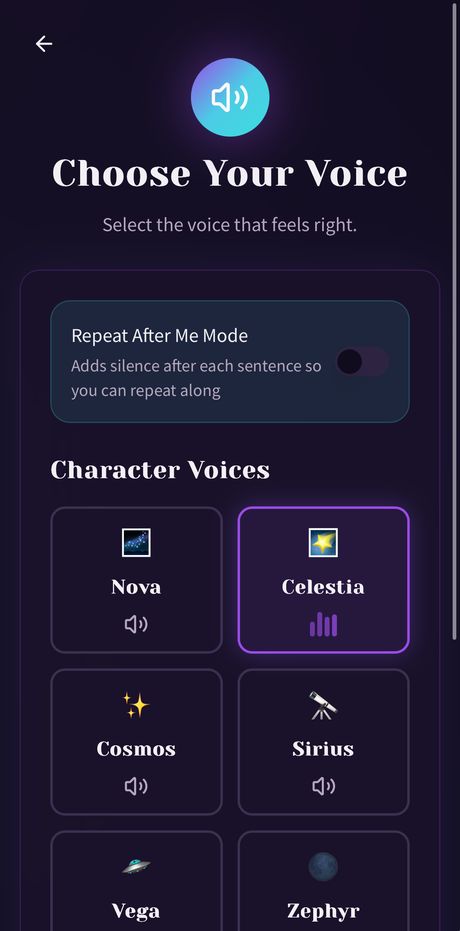 Pick a character voice
- Me
Came up with it from my own meditation practice
- MeAI
Wrote the affirmation scripts and designed the voices
- ElevenLabs
Voice cloning, with models that pay real voice artists for their voices
- MeAI
Layered the audio and built the app
- MeAI
Rebuilt it over a year of testing, including Counterweight, a version tuned for professionals
Voice cloning, so you record a short sample once and a model speaks every new affirmation in your own voice. I'd also love to work with mental health experts on guided programs people can follow from start to finish.
Project Antibody
AR interactive magazine · An immune system you can hold
- Augmented reality
- Print design
- Science illustration
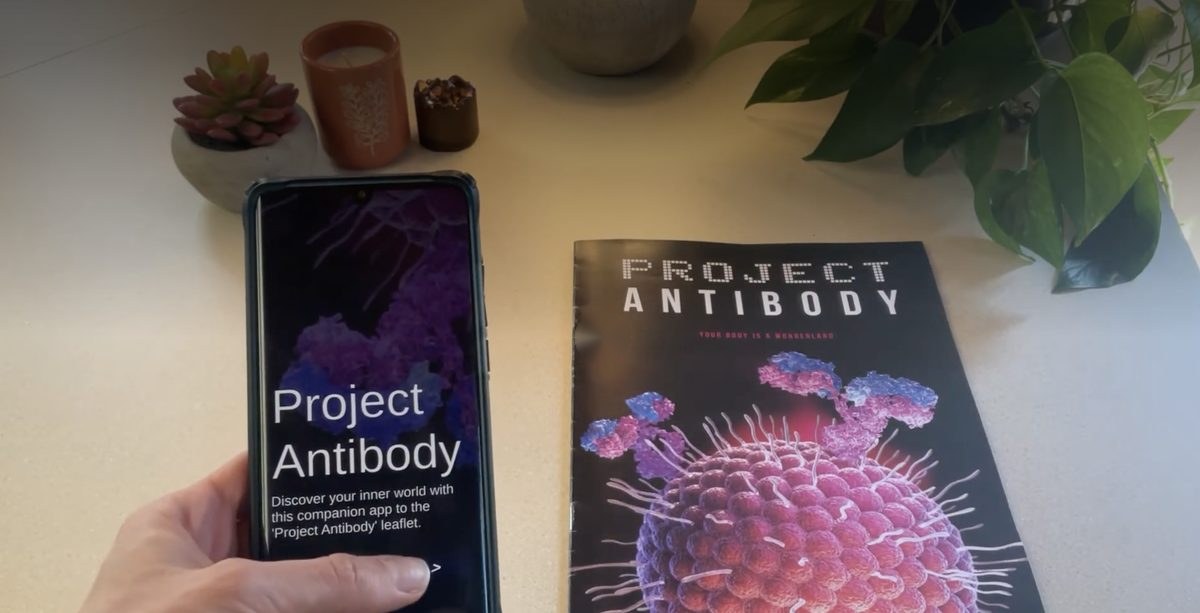
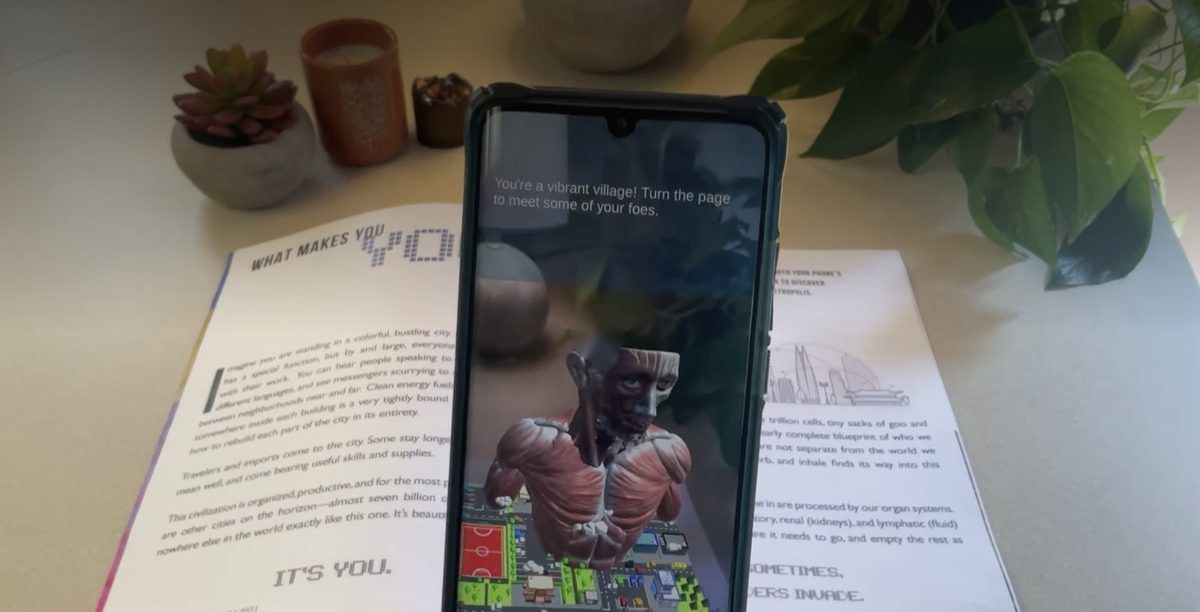
I made a printed magazine that comes alive when you hold a phone over the pages, putting the immune system in AR. It's part physical object and part digital experience.
- Audience
- 50 to 60 students and faculty at the Media Studio final presentations, which are open to all of CAMD, and the award jury
What the model doesNothing yet. I made Antibody in 2021, before frontier models, so the next step is where one comes in.
- Me
Came up with it in Northeastern’s Media Innovation Studio
- Me
Researched the science, wrote the copy, and designed the printed magazine
- Me
Built the AR layer that brings the pages to life
- Professor and classmates
Gave feedback along the way
- Me
Presented it at the Media Studio finals
Point your phone at your own arm, not a picture of one, and get AR models and content built around your own body.
Sketchbook
Prototypes and internal tools
Quick prototypes that each test a single idea, and the tools I've built to run my studio. When a tool we need doesn't exist, I build it with AI.
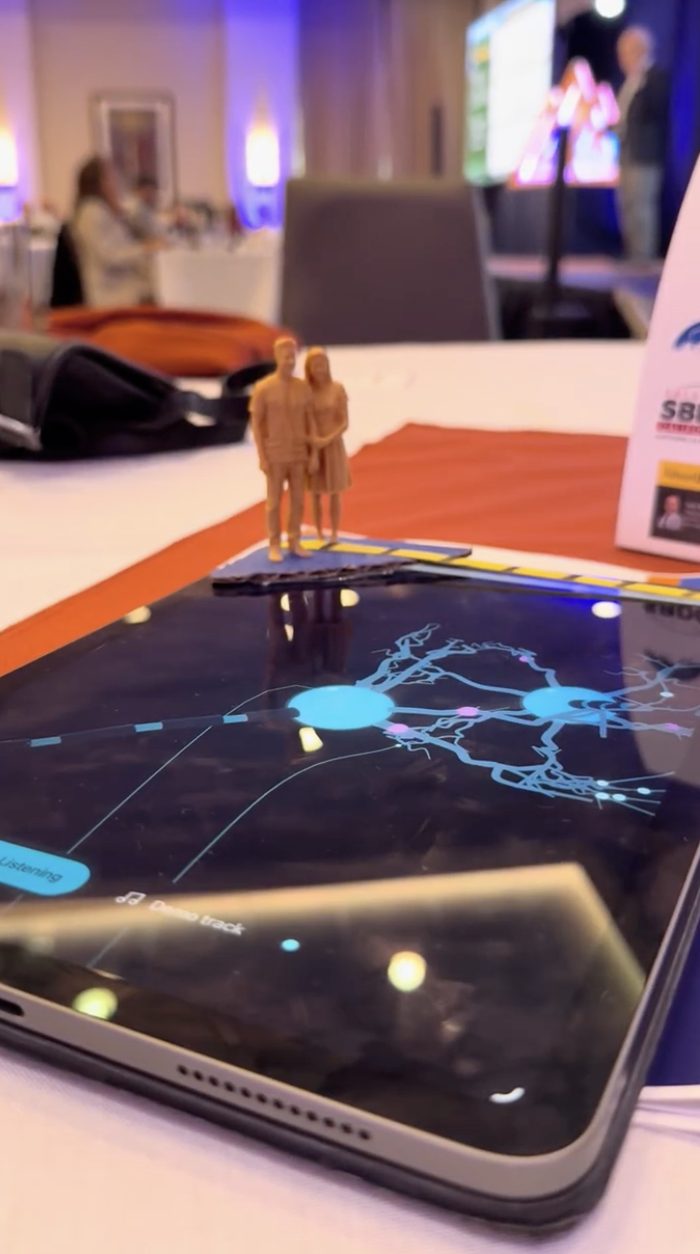
Neuron Pulse Sync
Audio visualizer
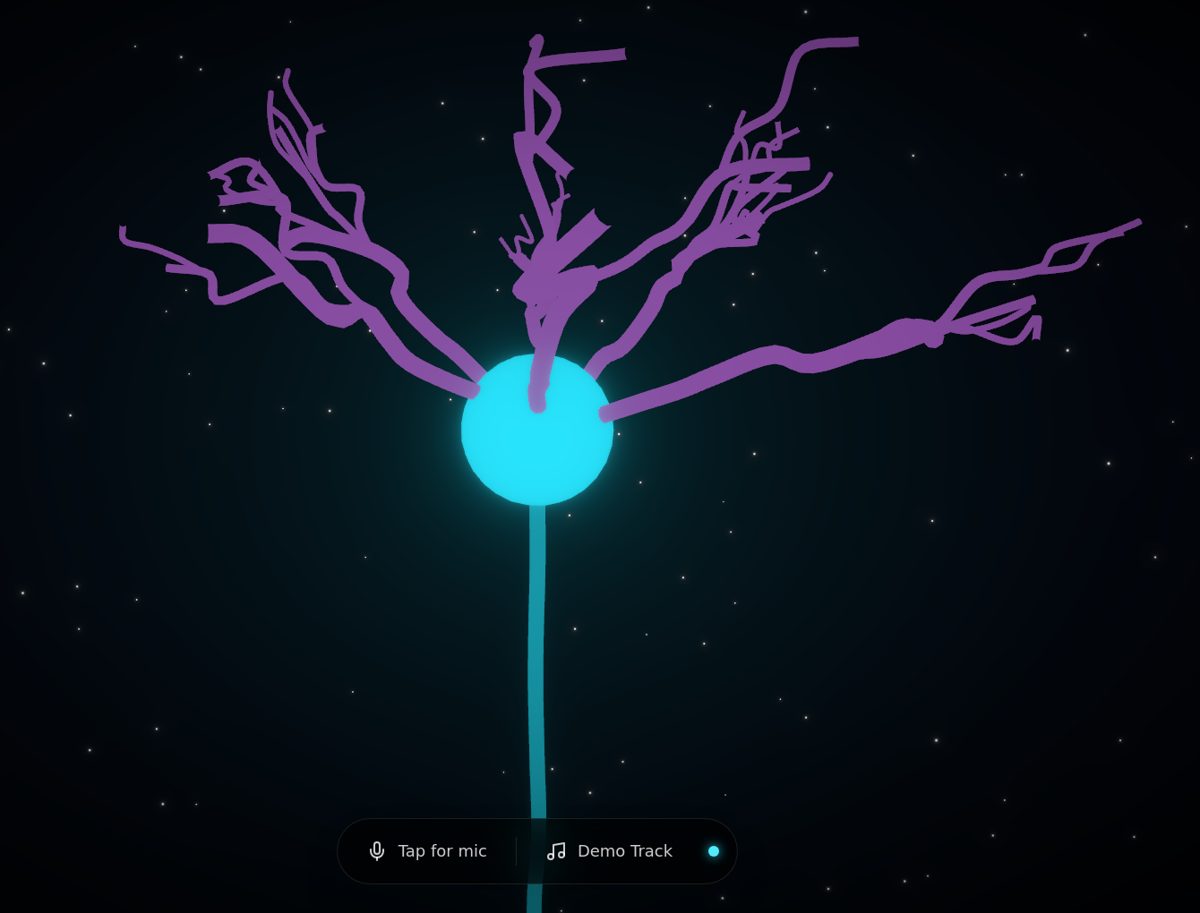
A neuron that fires to music. Pulses leave the cell body on the beat, and the melody travels out along the dendrites. It works with the mic or a demo track. I also mocked it up as a dancefloor, with scale figures standing on the iPad as the neuron fires under their feet.
Play ↗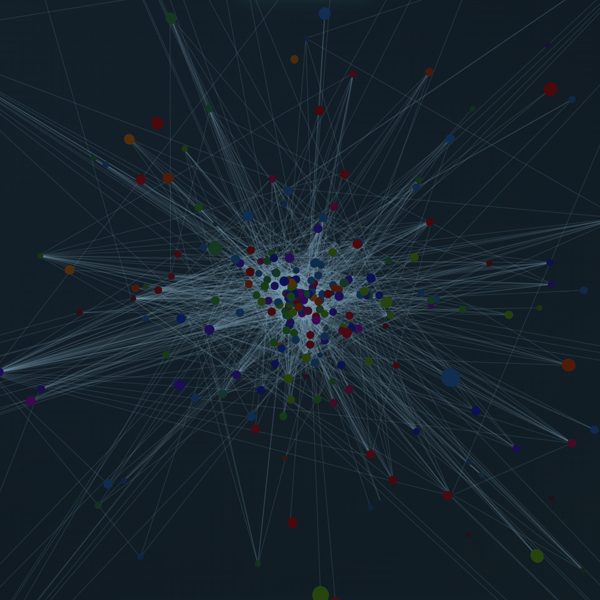
Kelp Forest Food Web
Data interactive
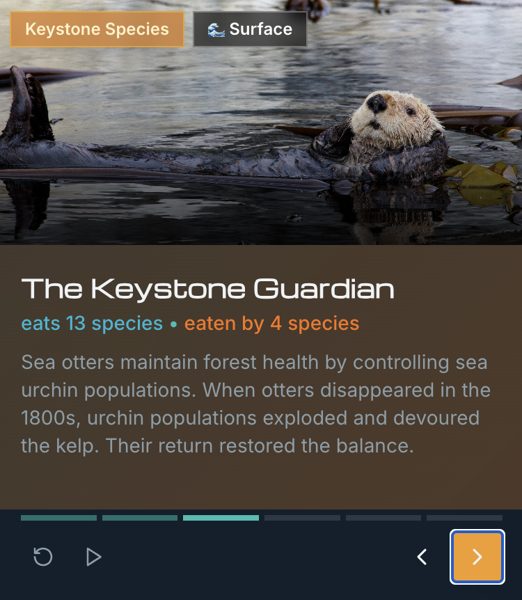
A 3D web of who eats whom in the Santa Barbara Channel kelp forest: 282 species and 1,383 interactions. Explore mode lets you spin the whole web and click any species to light up its connections. Story mode walks through the characters that hold it together, from giant kelp to sea otters to diatoms. It's a first step toward an exhibit people could touch. AI built everything on top of the research data, including most of the species art. Where the AI images got a species wrong, I swapped in accurate photos.
Data: the kelpforest database at UC Santa Cruz (Beas-Luna et al., 2014, PLoS ONE)
Explore ↗Mockup Studio
Drop in an image or video and get an animated 3D device mockup with orbit and reveal moves, studio lighting, and MP4 export up to 4K.
Cash Flow Canvas
Tracks income and expenses and projects the studio's cash position 12 months ahead. It's private, so there's no public link.
Color Contrast Checker
Tests brand palettes, type pairings, and gradients against accessibility contrast standards before anything ships.
Dead West
Self-serve curriculum
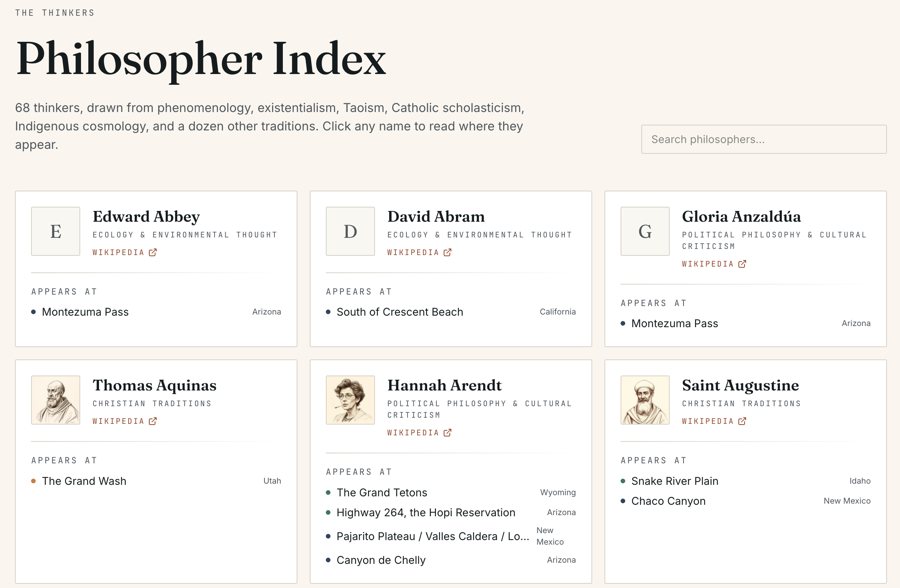
John R. Campbell's 400-page manuscript, a field journal of the American landscape, turned into a self-serve philosophy course. Forty-two places sit on a map, each with its essay, its location, and cards for the thinkers it draws on, 68 in all.
Banana Piano
Arduino
Six bananas and two tomatoes wired to an Arduino as touch keys. Tap one and it plays a note.
Strap Buckle
3D printing
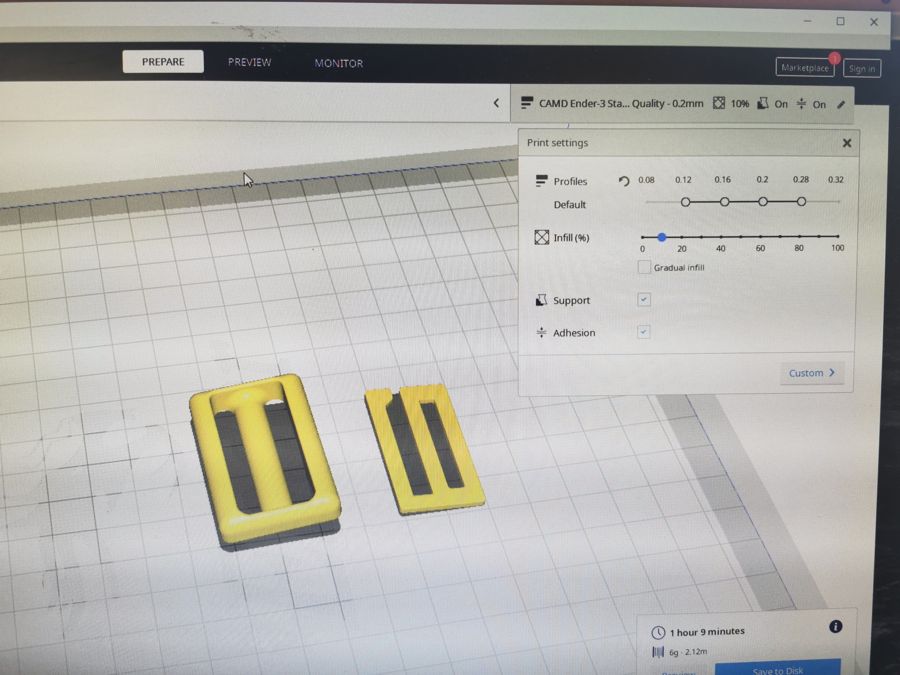
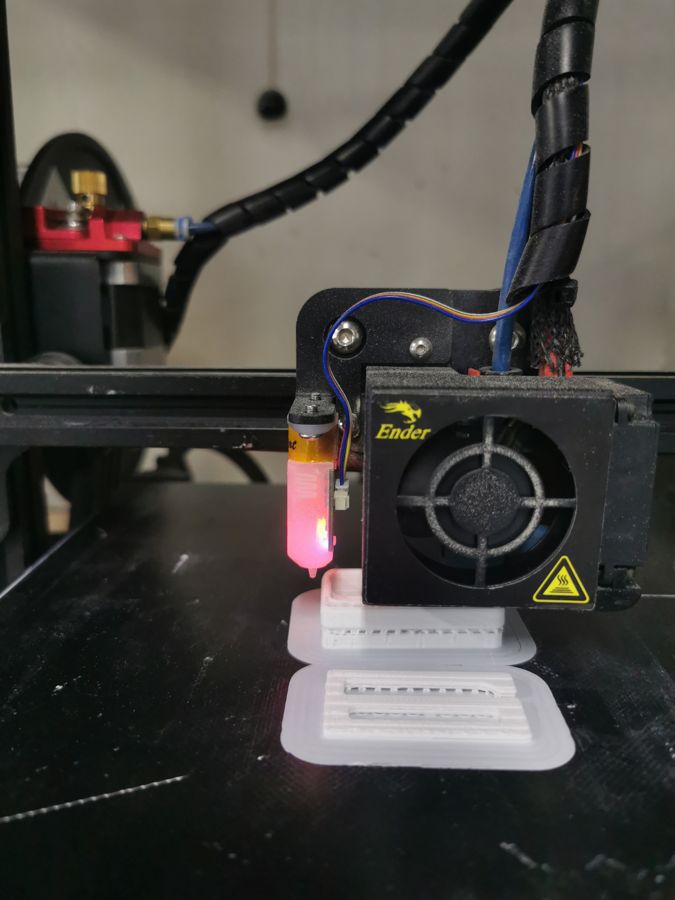
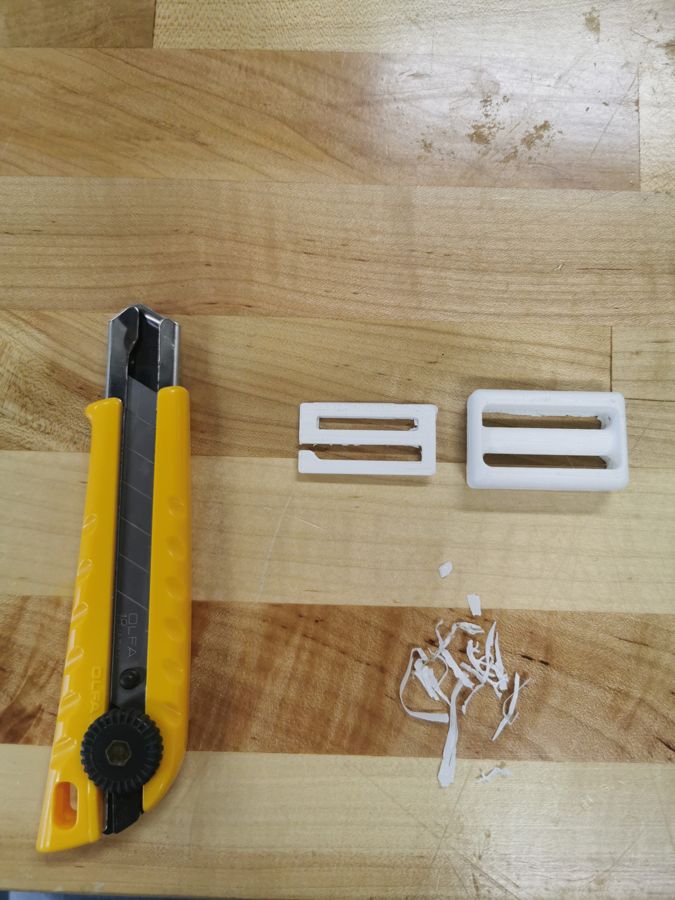
A test piece for Dirtbag, a product concept, to see whether additive manufacturing was a viable path for an e-commerce product. Sliced in Cura, printed on an Ender-3, and trimmed by hand.
Room Sensor
Arduino
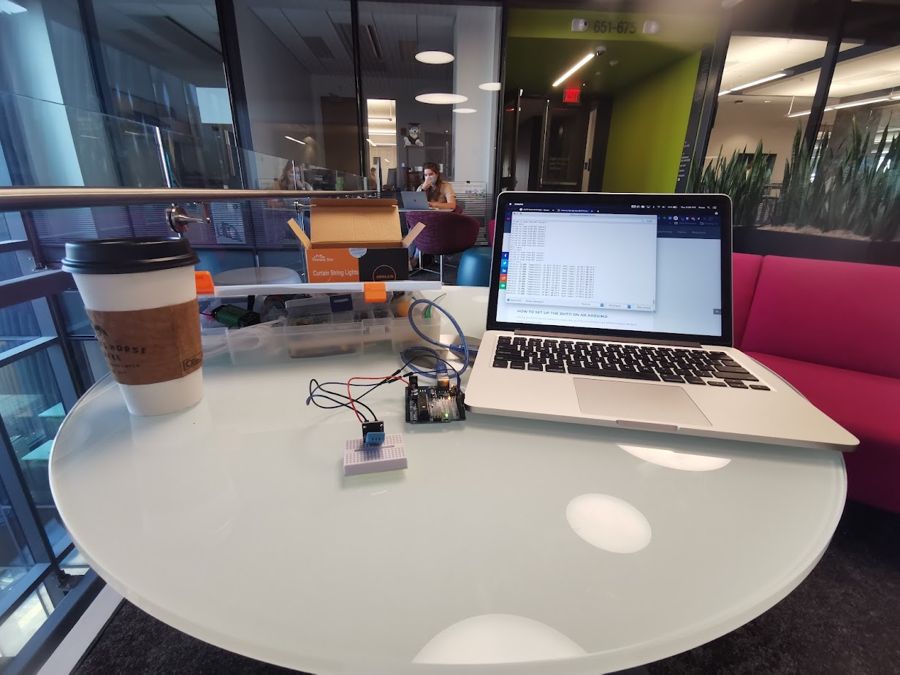
A DHT11 sensor sending temperature and humidity readings to my laptop from a café table.
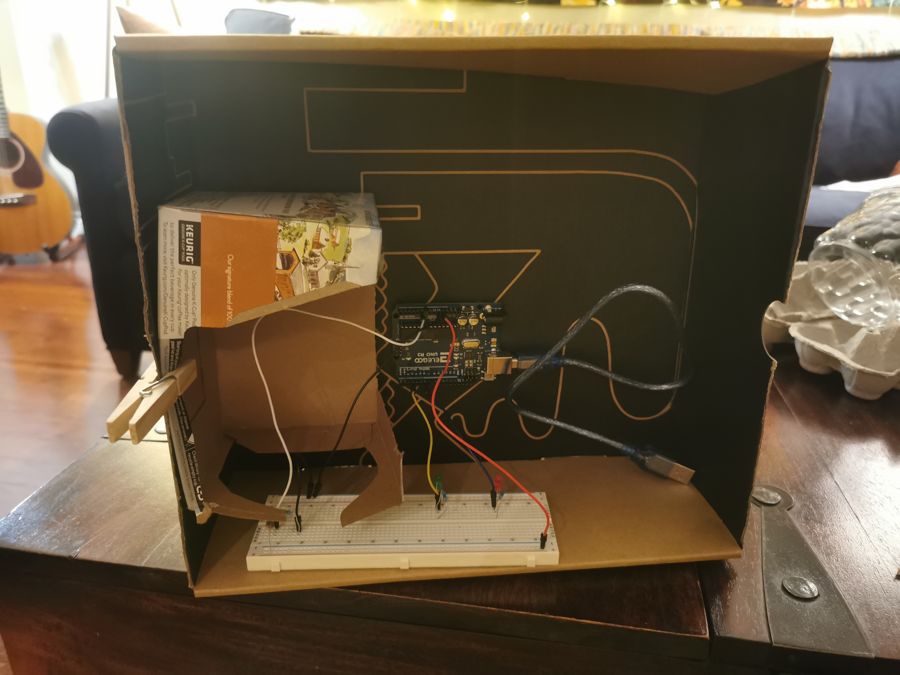
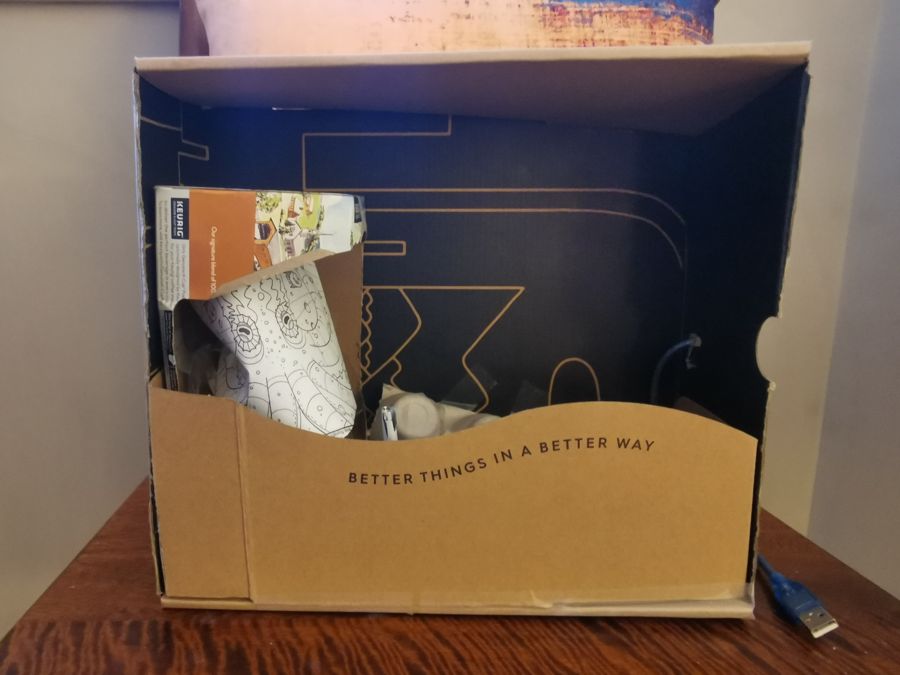
Octopus Aquarium
Arduino and cardboard
An interactive aquarium demo built in a shipping box. When it senses motion, the octopus lights up.
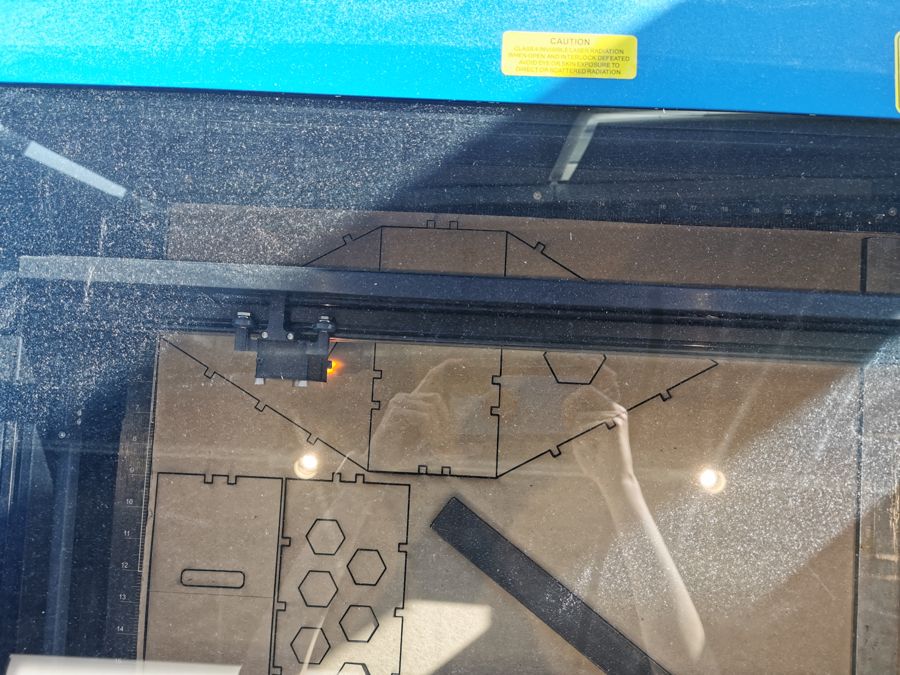
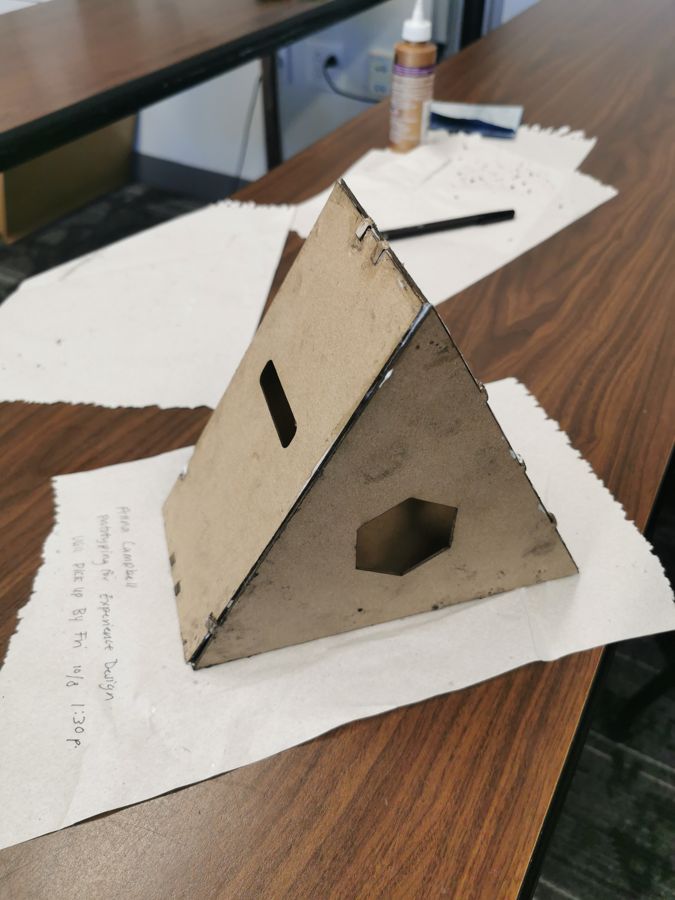
Triangle Planter
Laser cutting
A planter made from finger-jointed hardboard panels, cut on a laser cutter and glued into a triangle with a slot on one face and a hexagon window on the other.
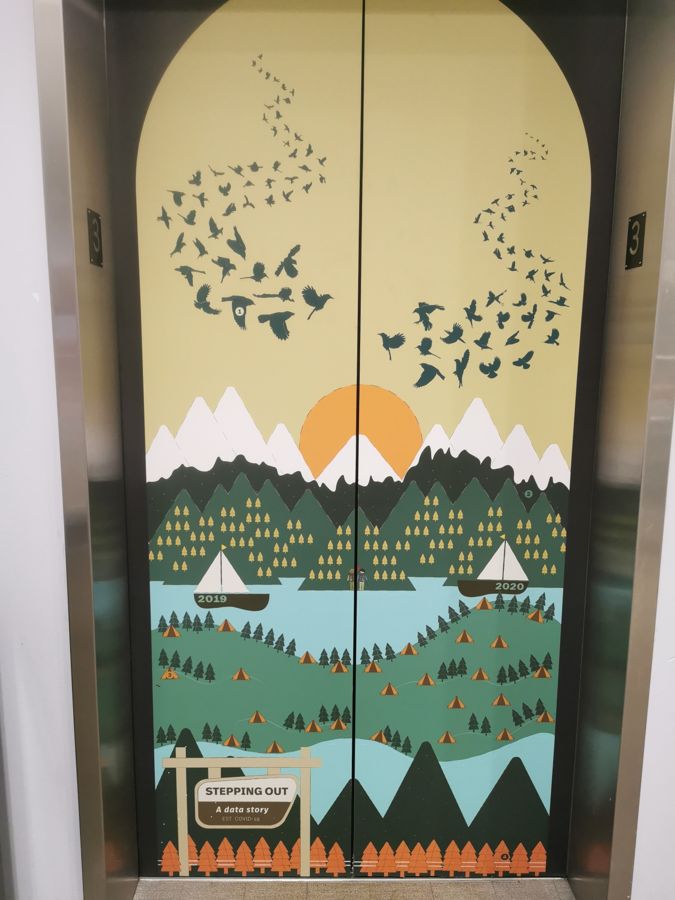
Stepping Out
Data story
A data story about time outdoors in 2019 and 2020, made with a team of four on a pair of elevator doors. My part was the birds, which I built by counting and sorting iNaturalist submissions and scaling each vector bird to match. I wish AI had been around to help with that.
AR Mural Hunt
AR scavenger hunt
A scavenger hunt through a set of murals, all about birds. At each stop, an AR scene adds a title, a 3D model or image, and a link to dig deeper, from paper crane mythology to the dinosaurs birds evolved from. The Stepping Out elevator became the Bird-a-vator stop.
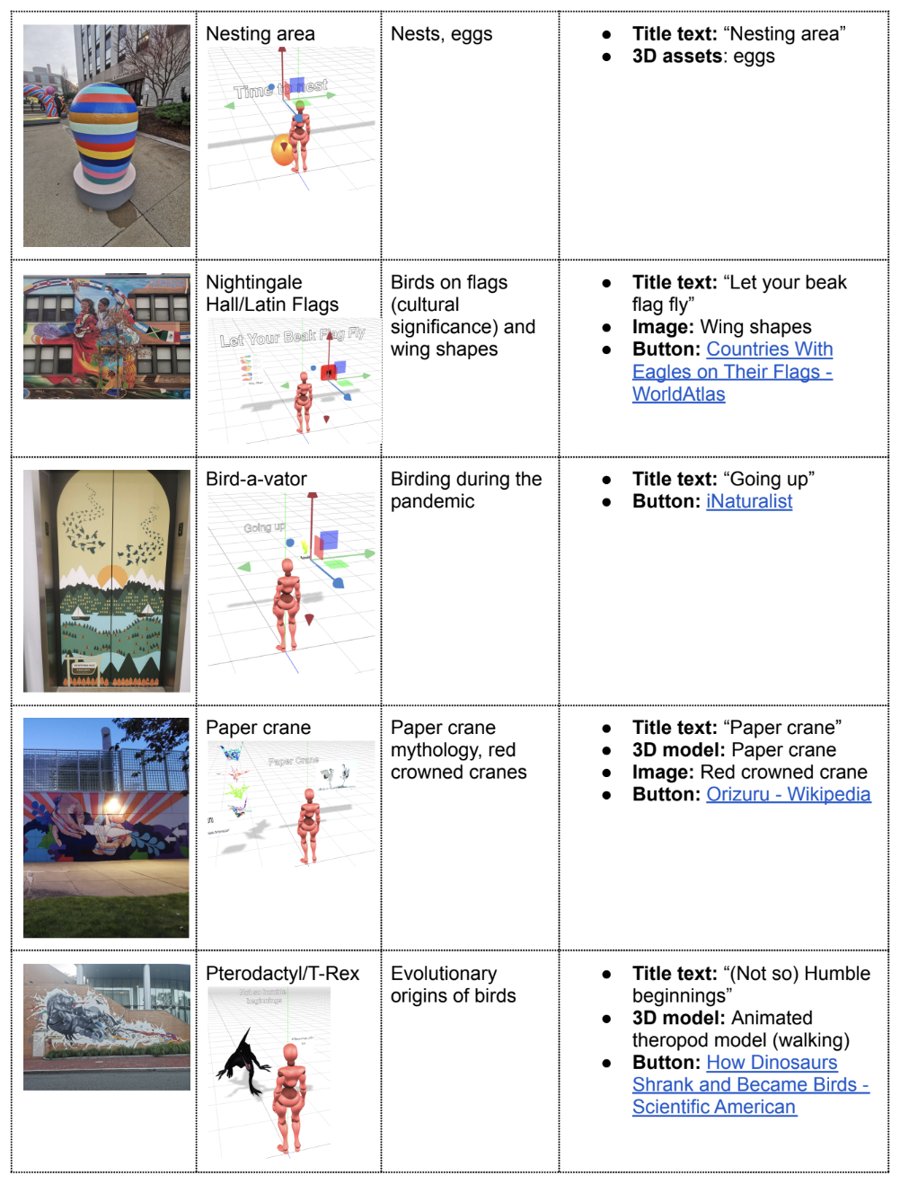
Hunt Storyboard
AR scavenger hunt
Each mural on the route, paired with its AR scene, its theme, and the title, model, and link that appear there.
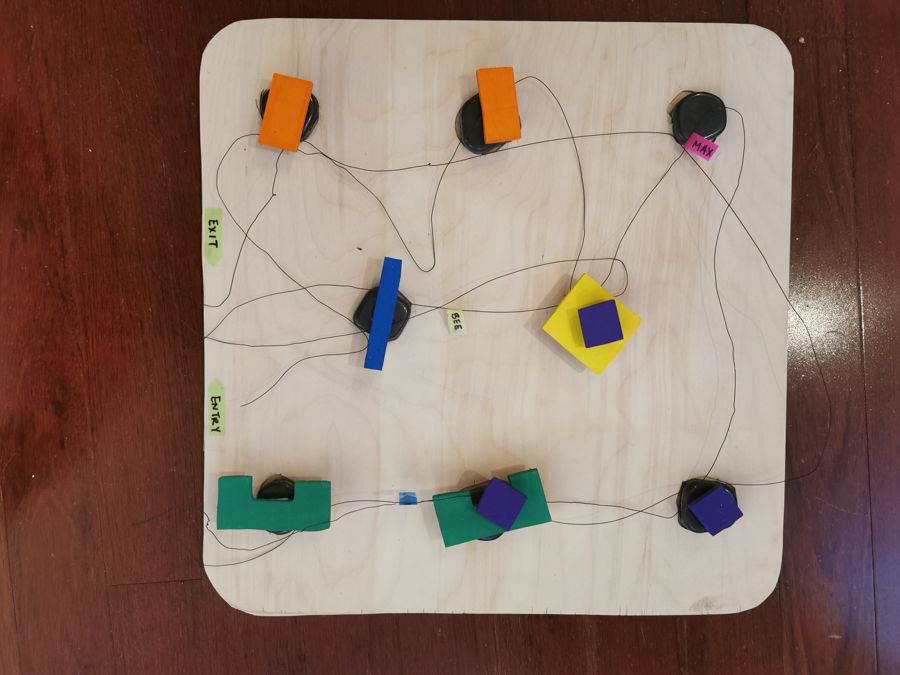
Museum Flow
Visitor flow model
A plywood floor plan for working out how different types of museum visitors move through an exhibit. Each wire traces one visitor's path from entry to exit, so the layout can make every path a good one.
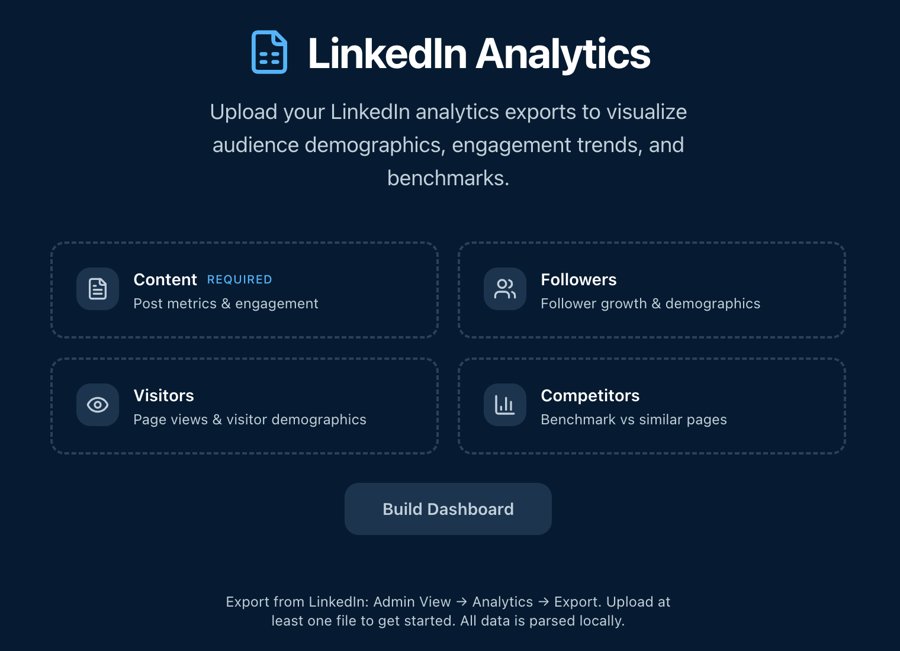
LinkedIn Audience Tool
In beta
Upload an organization's LinkedIn analytics exports and it charts who the page reaches now, with audience demographics, engagement trends, and benchmarks against similar pages. Built in Lovable (on Claude) for Recess, and growing into an organizational communications assessment.